REPLAY WINDOW
30 DAYS
Right-click any chart, pick a moment, and the terminal rebuilds it — every trade, every DOM update, the book, VPIN, the liquidation map. Then scrub it like footage.
No exports, no setup, no separate app. Any pair, any timestamp in the last 30 days — FILUSDT last Tuesday at 03:47 included. The terminal switches to replay in place; the amber badge is the only difference.
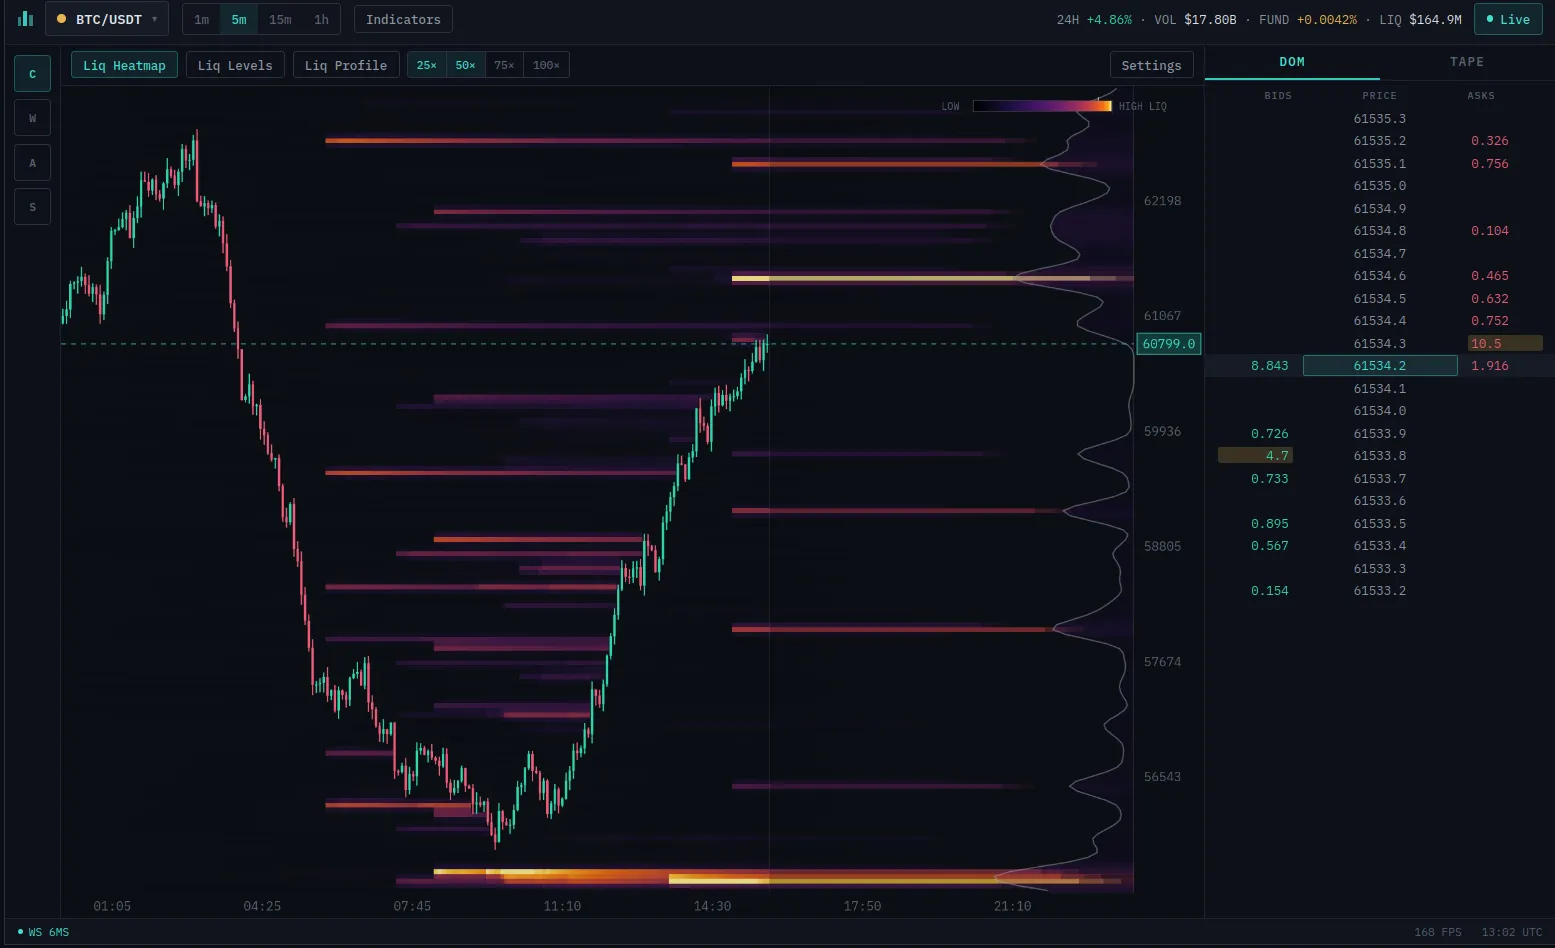
Replay re-runs the recorded feed through the same engine that renders live. The tape re-prints, the book re-builds, VPIN re-computes, and bands on the liquidation map ignite and burn out exactly as they did.
You can't drill your read of a move if the move changes on every viewing. EdgeDepth replay is 100% deterministic — same ticks, same frames, bit-exact on every run — so study becomes repeatable: rewind, re-watch, test your read against the same tape until the pattern is yours.
The 30-day window rolls forward, but archived events are pinned permanently — a cascade from last year replays today exactly as it printed. That's also what makes guided lessons possible: authors annotate exact ticks, and those ticks never move.