Real positions, with coverage in view
The Hyperliquid
liquidation heatmap.
Most liquidation maps infer where leverage might break. Hyperliquid publishes each account’s open positions with its own liquidation prices. EdgeDepth reads them from its own Hyperliquid node every minute and draws the significant levels as rails, kept with their start and end so you can replay a move against them.
Free on BTC, Pro on every other coin · Long rails below mark, short rails above · Coverage in the chart’s key · Hyperliquid replay about six weeks so far
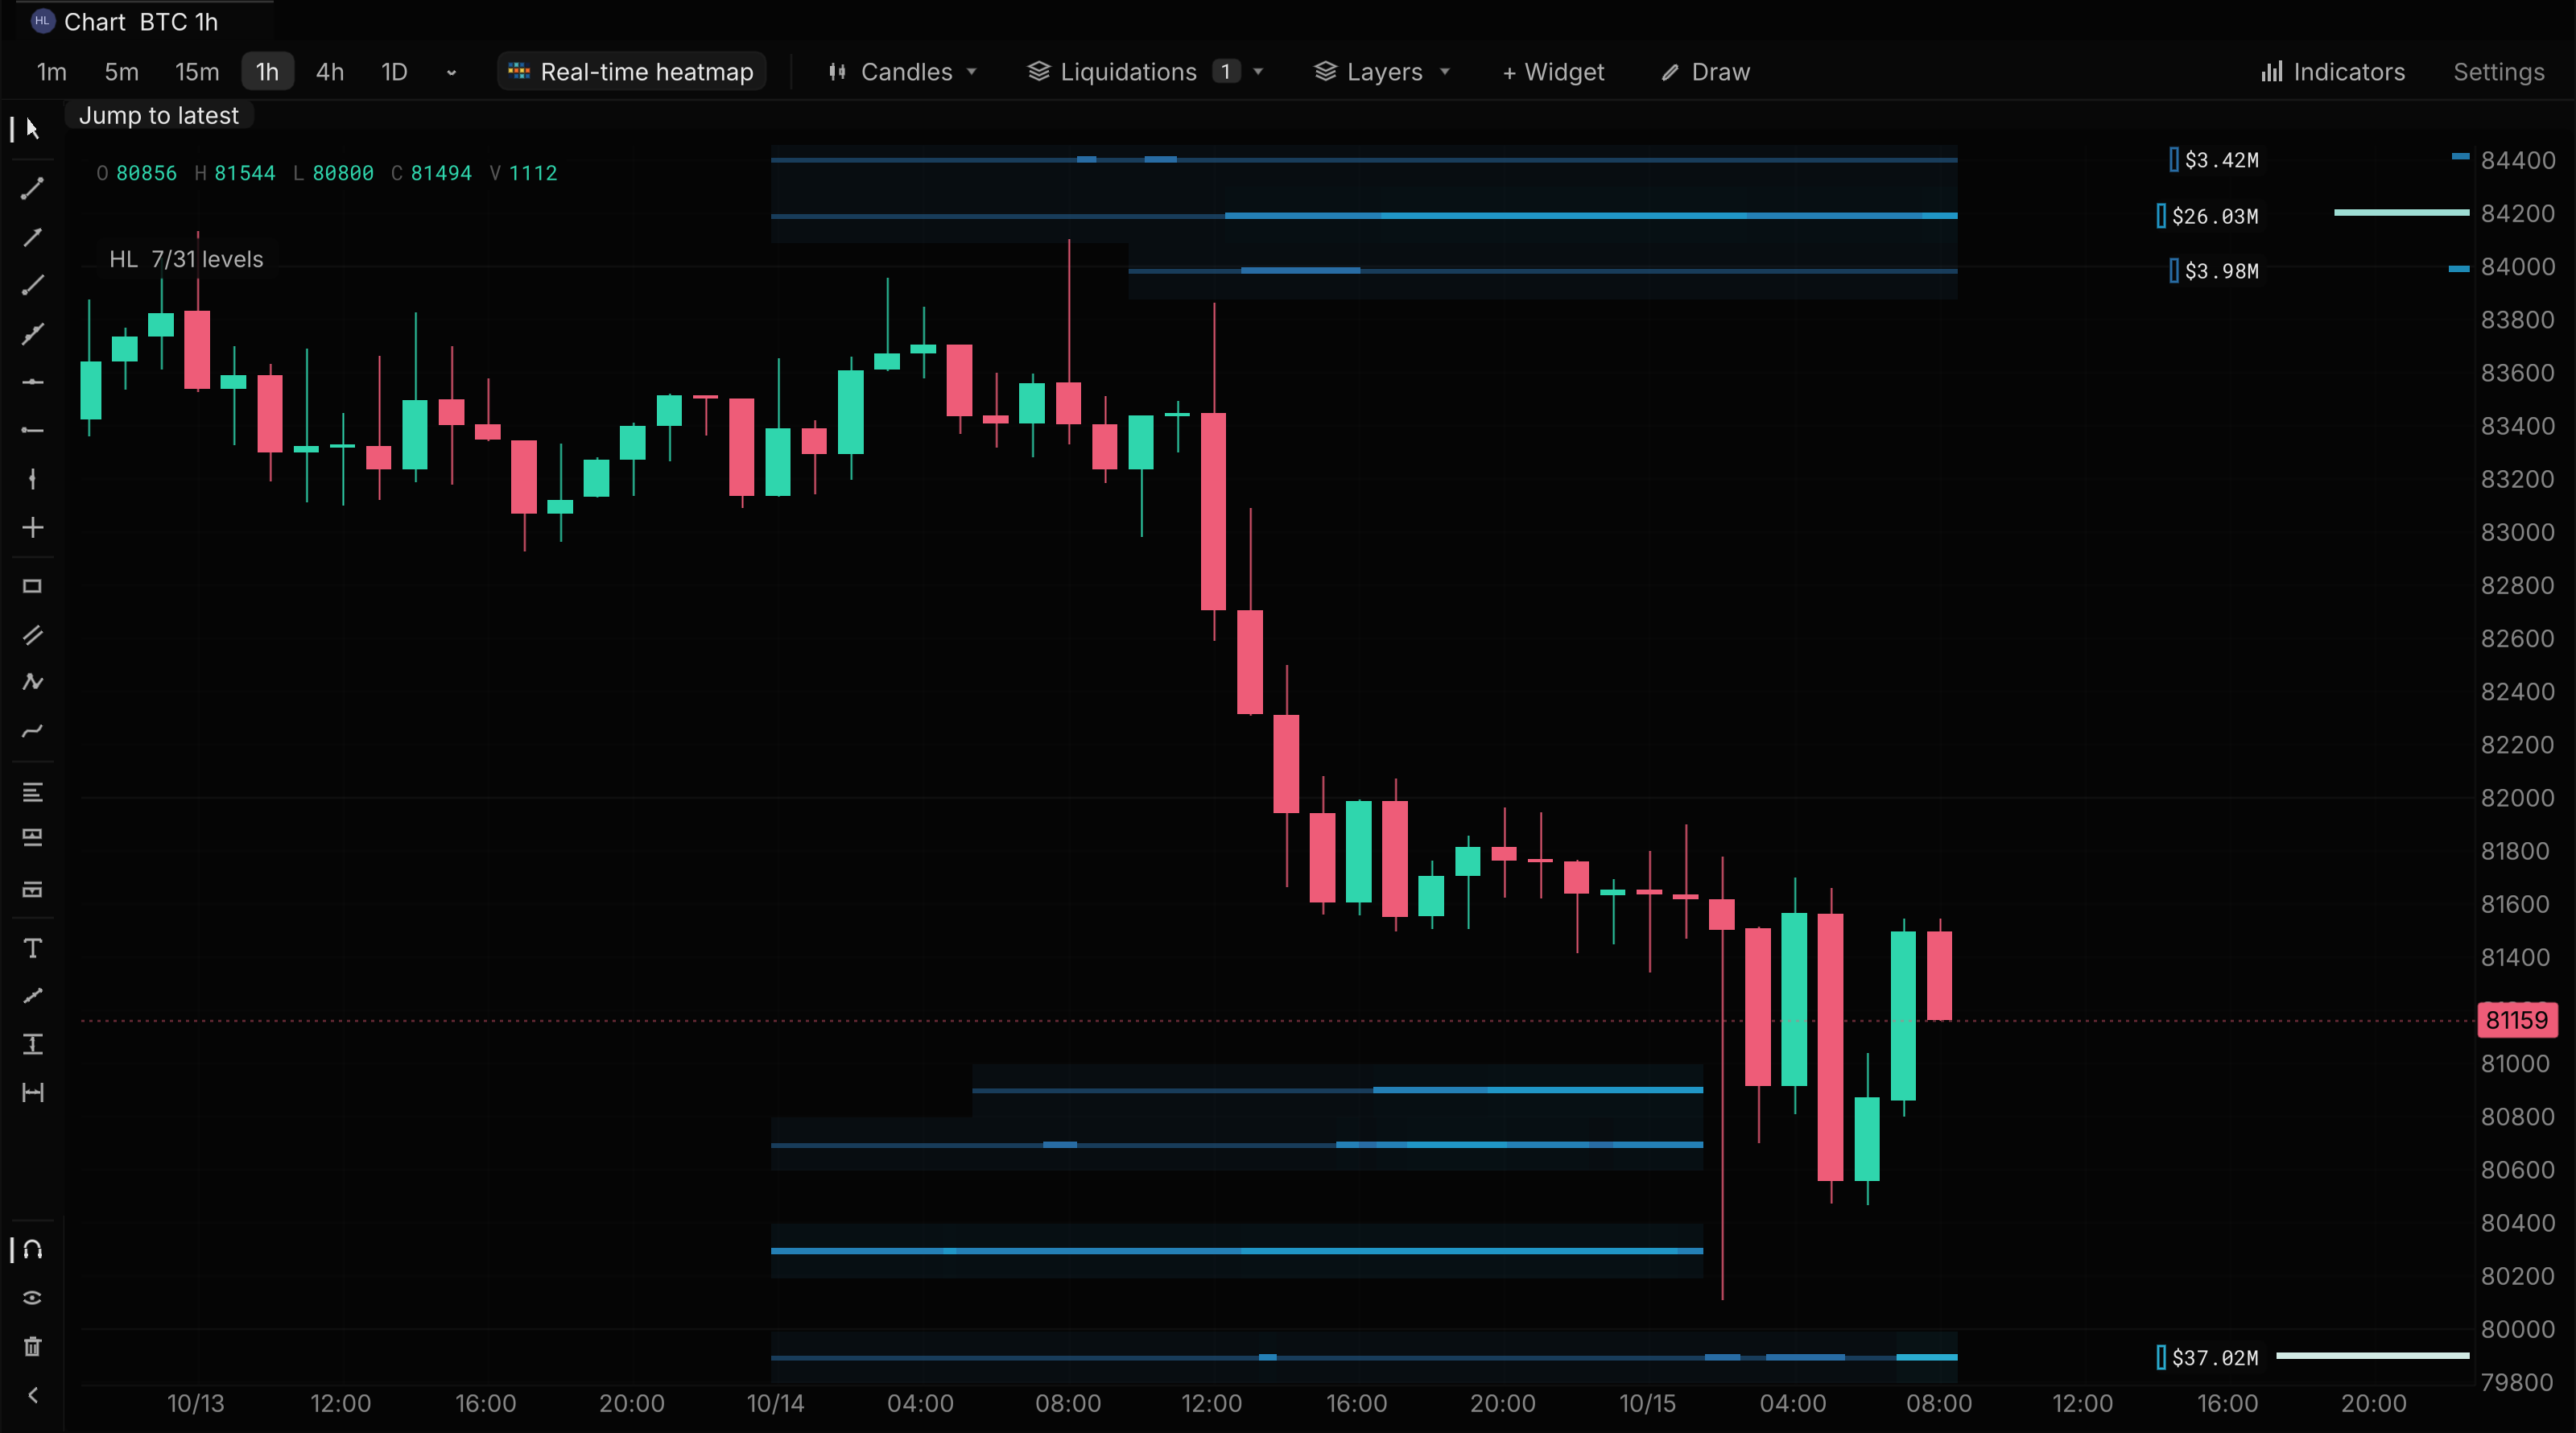
BTC/USDC · Hyperliquid 1h · Rails from 14 Oct to 15 Oct 2026, 08:18 UTC · Live chart of real recorded data, major levels with value labels and the profile at the right edge · Select image for full capture
- 01
Real positions
Levels come from open positions Hyperliquid exposes, at the exchange’s own liquidation prices and real leverage, not a one-divided-by-leverage shortcut.
- 02
Coverage you can see
The chart’s key states how much of the venue’s open interest the current census locates. A small share is never stretched into a claim about the whole market.
- 03
Replay the interaction
Return to a recorded move and watch how price interacted with the rails, with the book and trades beside it.
The data path
Read from our own node, not a leverage guess.
Hyperliquid has no single endpoint for every open position. EdgeDepth runs its own Hyperliquid node and reads the account state of every wallet seen trading, about 212,000 on 15 Oct, once a minute. It keeps each position’s exchange-reported liquidation price and real leverage, sets aside positions with no usable price near the mark, then totals the rest by side and 0.25% price bin before anything reaches the chart.
See the Binance and Bybit liquidation heatmap ↗Playback unavailable. Open the video directly.
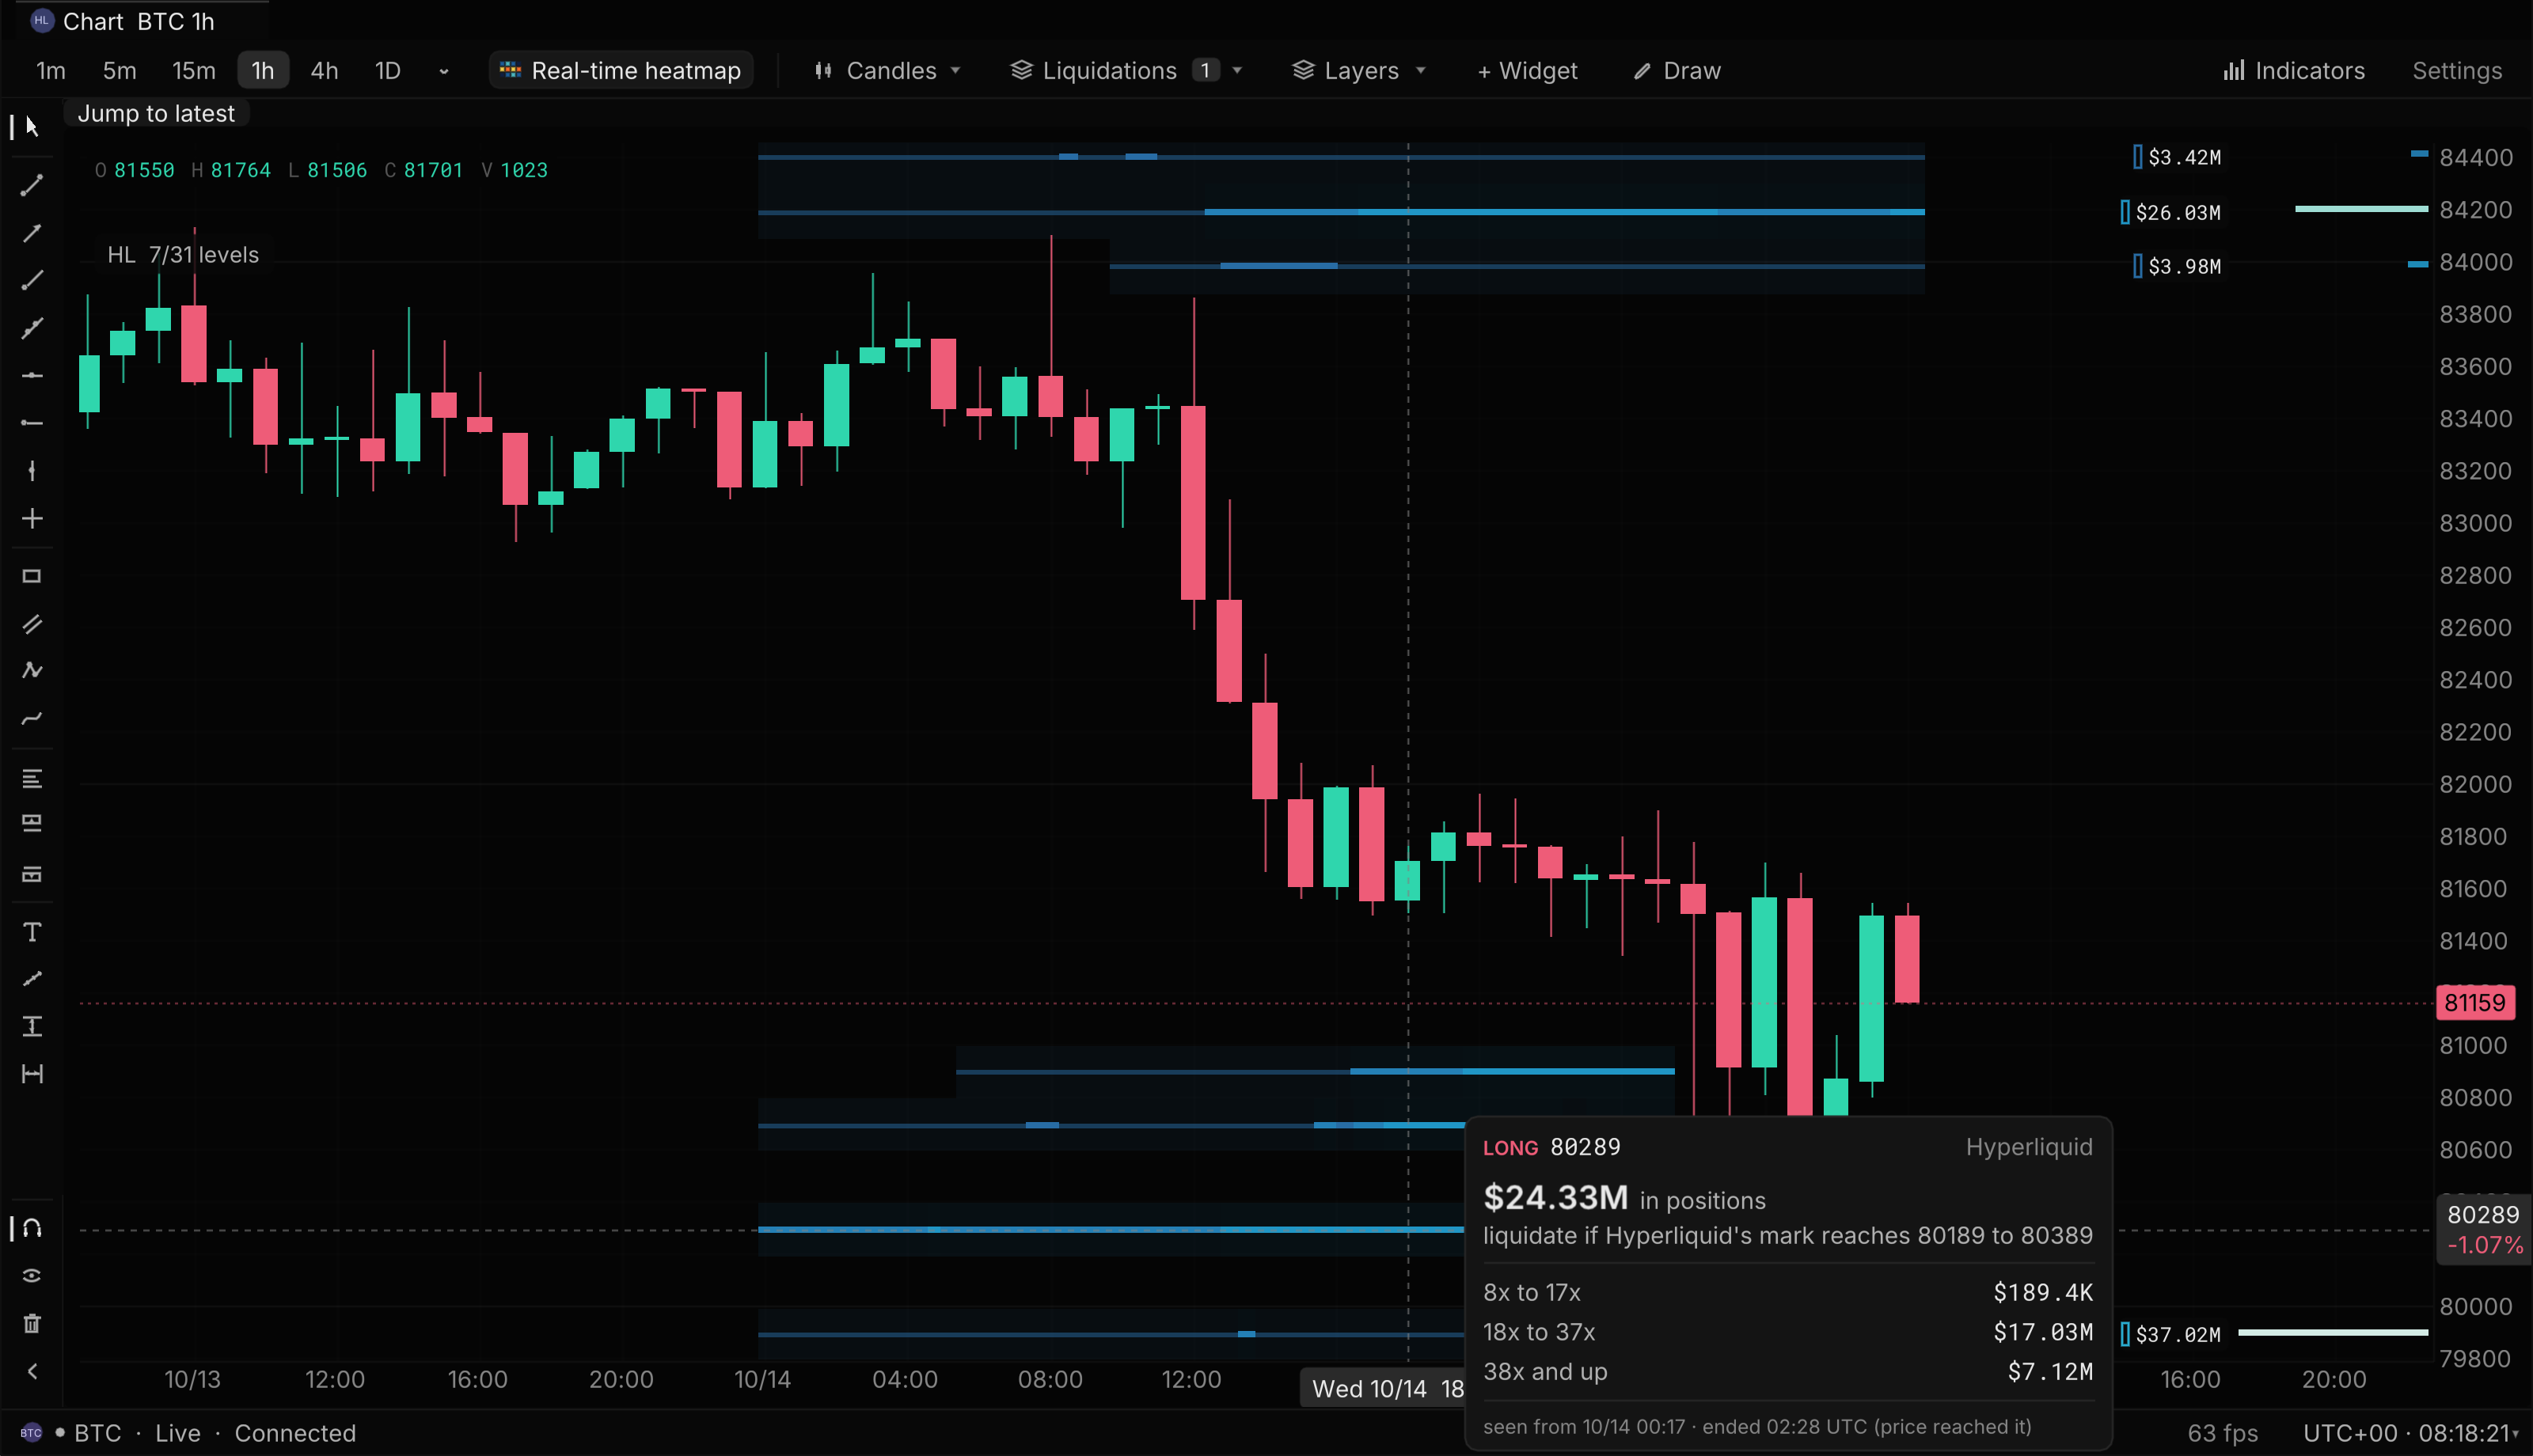
The same BTC chart, hovering a $24.33M long rail at 80,289 that ended at 02:28 UTC on 15 Oct when price reached it · A live chart, not a replay frame
Replay
Replay the move against the levels.
Open a recorded Hyperliquid market at the time you care about. Replay the book and trades and watch how price interacted with the rails: whether it reached one, stalled short of it or ran through. Each rail keeps the start and end the server recorded, so nothing is redrawn with what became known later.
Explore recorded replay ↗Live BTC map
Open the BTC liquidation heatmap on Hyperliquid.
See current levels from real Hyperliquid positions beside BTC candles, with the located share of open interest shown on the page.

How the census works
Four steps from our node to a rail.
Hyperliquid has no single endpoint for every open position. The map comes from reading every account our node has seen trade, keeping the positions with a usable liquidation price, and totalling them before anything is drawn.
- 01
Read every wallet
Our own Hyperliquid node answers an account-state read for every wallet seen trading, about 212,000 on 15 Oct, once a minute. That covered 98.7% of BTC open interest that day.
- 02
Keep usable levels
A position counts when Hyperliquid gives it a liquidation price within about 32% of the mark, and a cross-margin one only when that price is within 90% of it. The rest is counted in the key as unlocated, not drawn.
- 03
Read the exchange level
For each position, the system reads Hyperliquid’s own liquidation price and real leverage. It does not substitute the usual one-divided-by-leverage shortcut.
- 04
Rails, then draw
The server totals positions by side and 0.25% price bin. A bin among the few holding 80% of its side’s dollars becomes a rail, fixed at its price until a candle reaches it or its positions close. Only those totals reach the chart, never a wallet.
Three layers, three claims
Modeled rails, real positions and reported events stay separate.
Real does not mean complete
The node reads every wallet it has seen trade, which on 15 Oct came to 98.7% of BTC open interest, but a level needs a usable liquidation price near the mark. The chart’s key shows the located share; at the time of the BTC chart above it read $1.43B of $3.20B (44.8%). Cross-margin positions with no usable price, and levels far from the mark, are left out rather than painted as false precision.
History and replay
Up to seven days of rails load as the view reaches back, each with the start and end the server recorded; a replay draws the rails as recorded at the time. Hyperliquid replay covers about six weeks so far. A rail ends at the candle that reaches it or when its positions close; a price crossing does not confirm a liquidation.
Cross-venue overlays
Levels are keyed by underlying and USD price, so BTC levels can be overlaid on a Binance BTCUSDT chart as an explicitly labeled Hyperliquid source. The layer is unavailable where there is no matching Hyperliquid market.
Privacy
Only price-bucketed totals reach the chart and the public pages: no wallet-level position history and no wallet leaderboard. Raw account readings are kept privately for research and quality checks and are never published.
Coverage and plan access vary. Compare plans · See what is in development
Explore it for yourself
Put real Hyperliquid levels beside the live book.
Open a market, turn on Hyperliquid positions in the Liquidations menu and read the located share before you read the levels.
Free on BTC, Pro on every other coin · Long rails below mark, short rails above · Coverage in the chart’s key · Hyperliquid replay about six weeks so far