edgedepth EARLY ACCESS

Order flow, in context

Watch the book
and trades meet.

See resting bids and offers, executed buys and sells, and reported liquidations together. Follow what changes as price approaches a level.

NewRefill levels mark icebergs and absorption: prices where aggressive orders kept meeting liquidity that refilled.

Binance USDT-M perpetuals, from majors to smaller markets.
Live real-time mode: free all day on Binance Futures BTCUSDT and 3 minutes a day on other markets; all day everywhere on Pro or Research. Large-print bubbles on candles and recorded replays: every plan.

One chart. Different questions.

Look inside the move.

Follow the liquidity, the trading and the reported liquidations. Control each layer independently in the terminal.

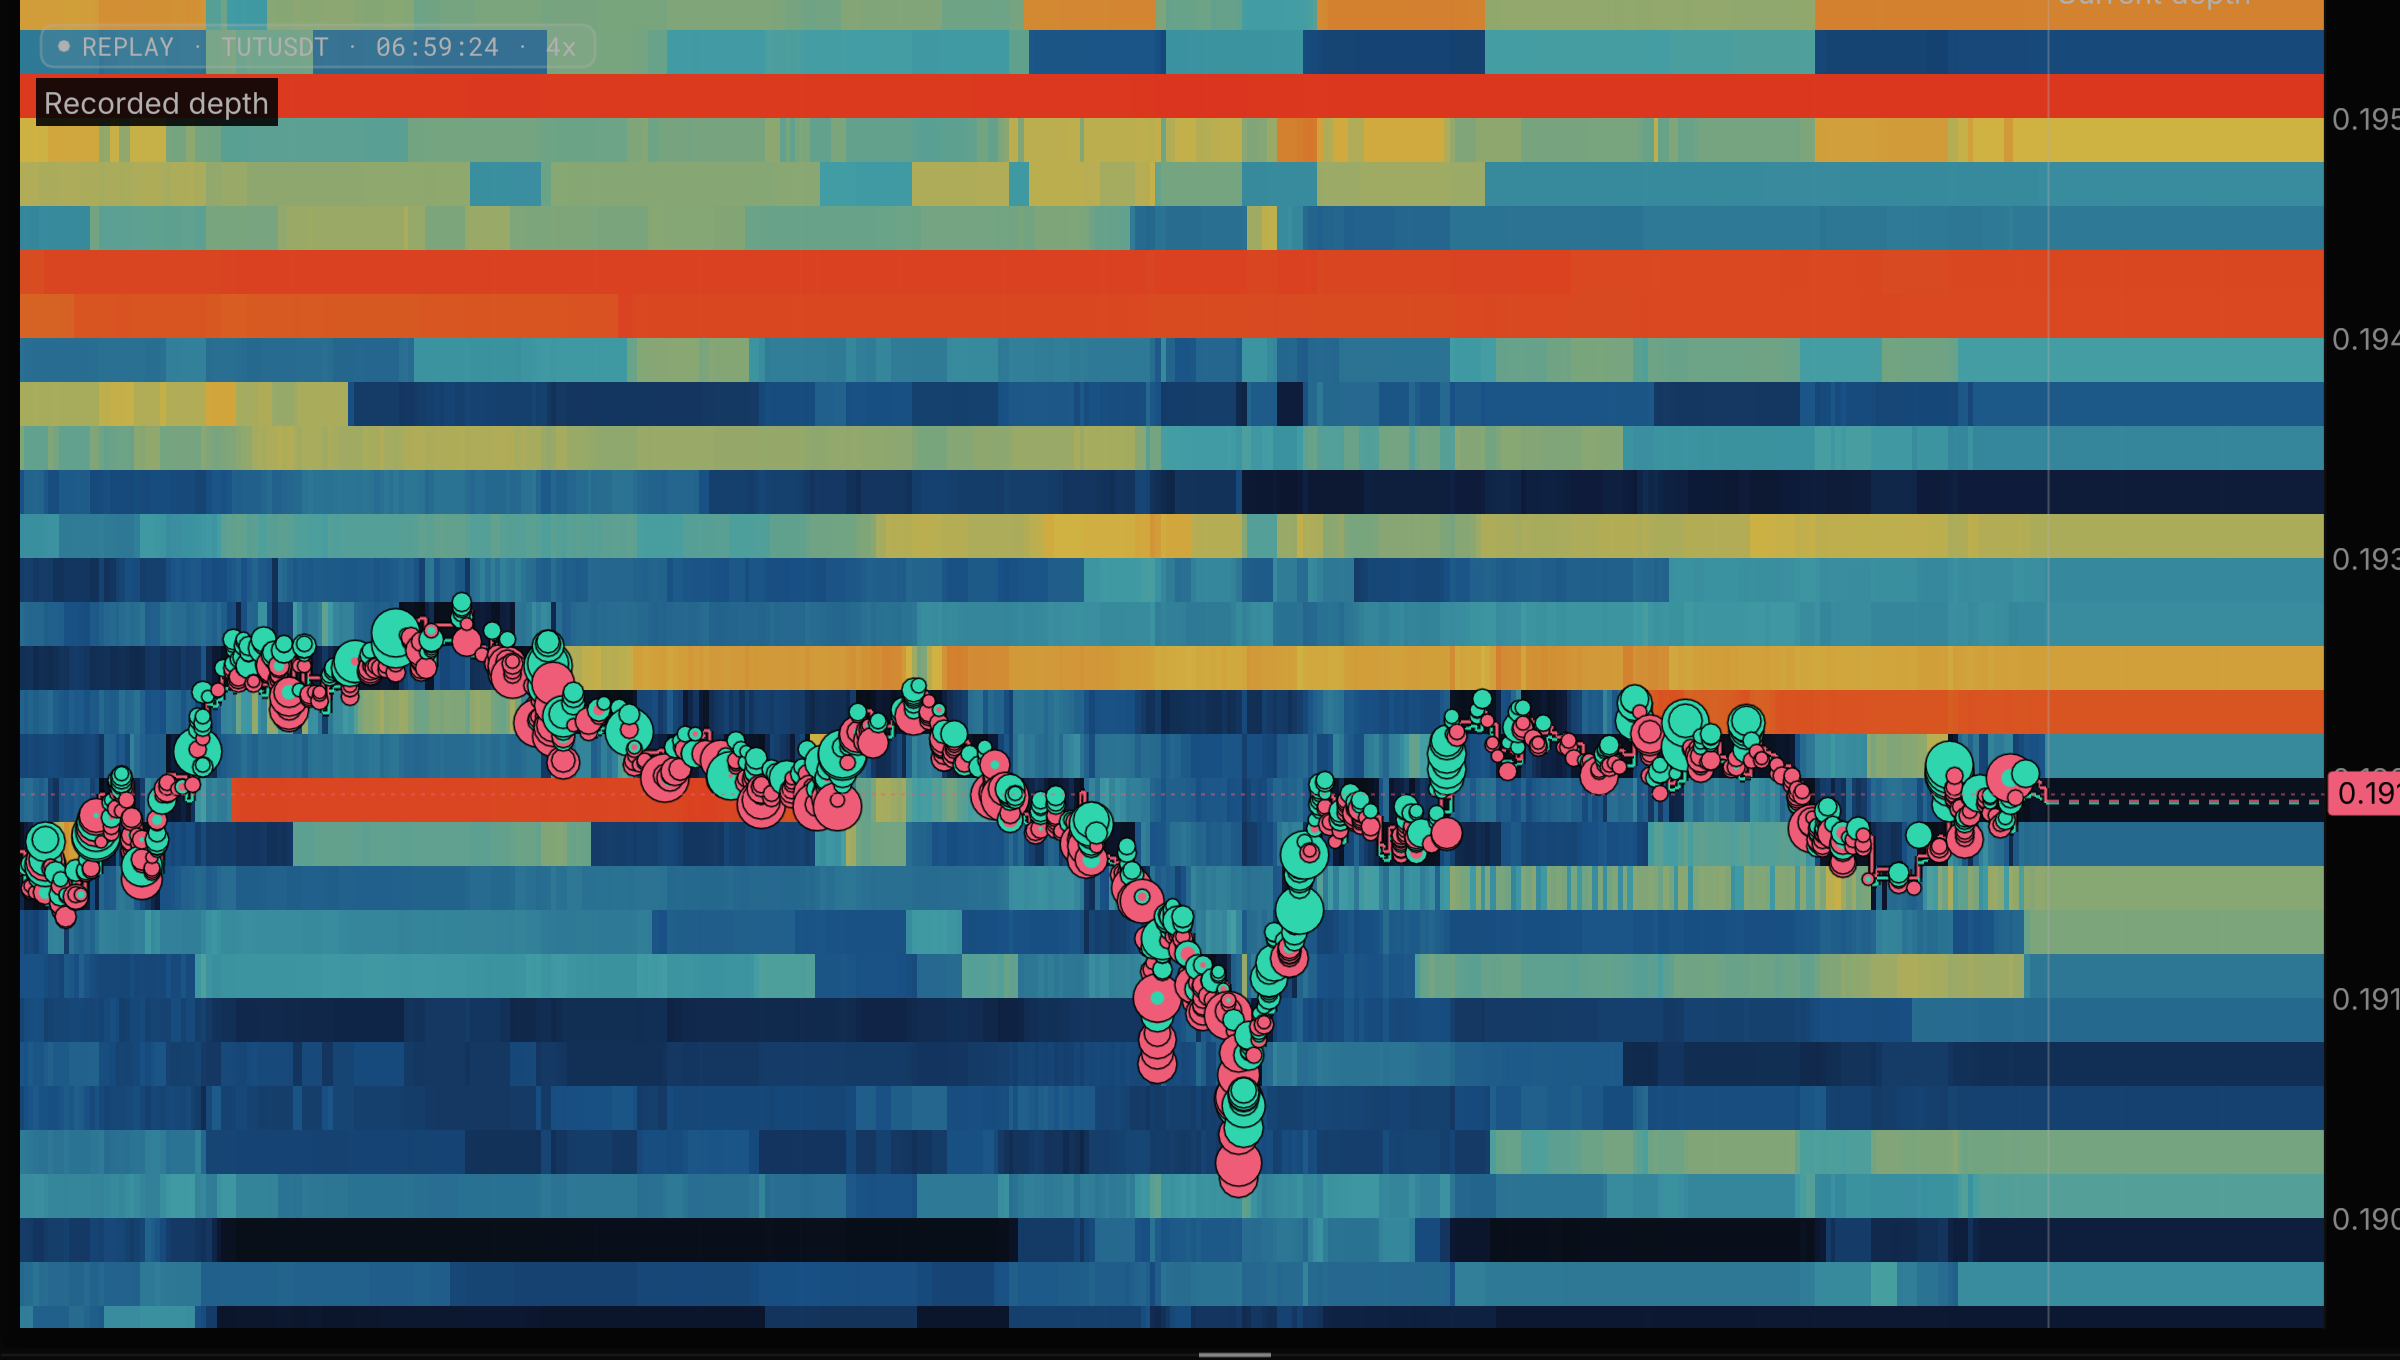
Recorded TUT/USDT resting-depth bands in blue, yellow and orange, with the trade path running through them, at 06:59:24 UTC

Resting liquidity

Where is the book building?

Follow resting bids and offers as they build, shift or disappear. Read the trade path against the liquidity around it.

Brighter bands show more sampled resting depth. Orders can change or cancel before trading.

TUT/USDT · Binance Futures · Real-time replay, 9 Aug 2026, 06:59:24 UTC
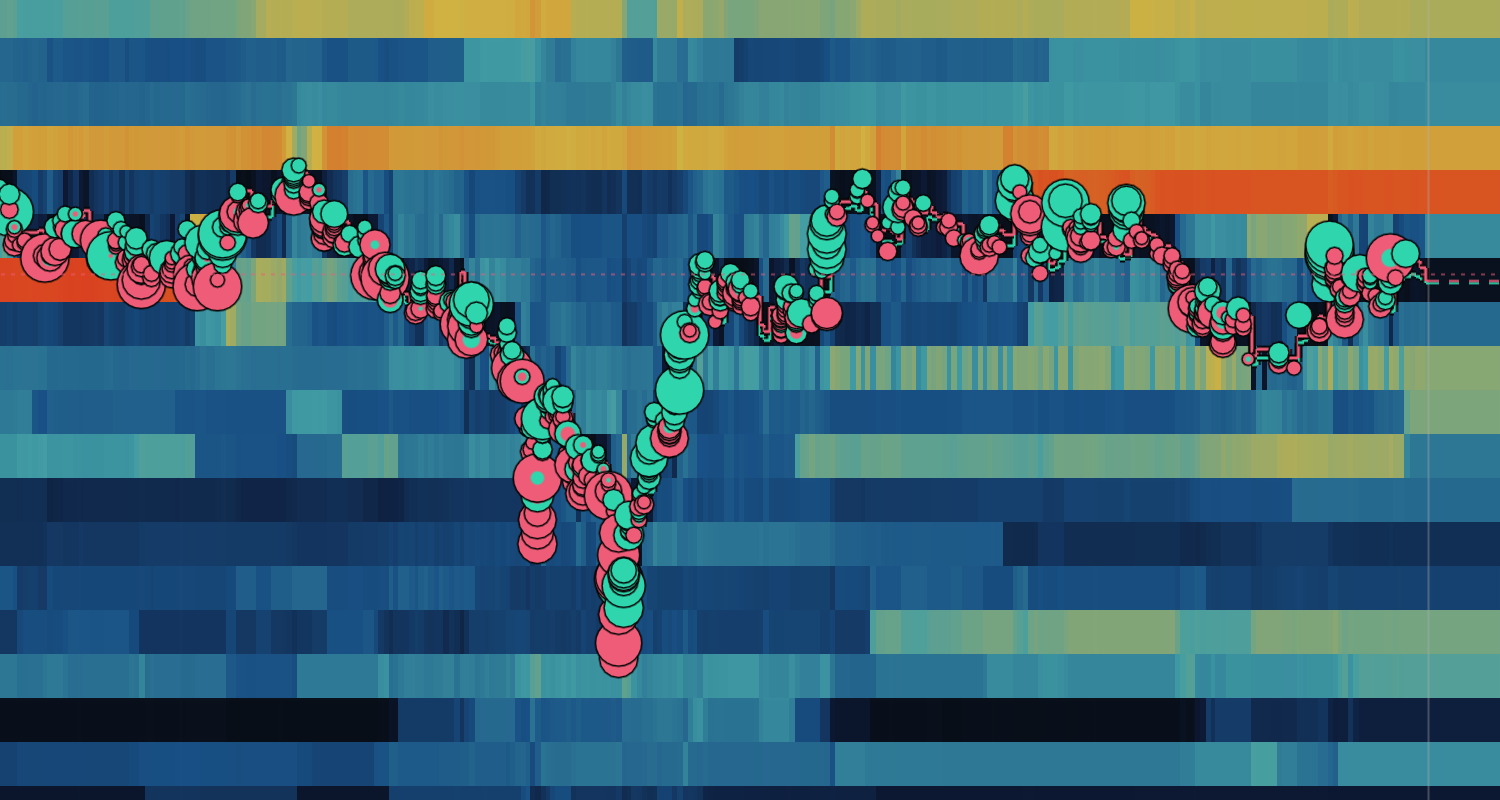
Recorded TUT/USDT buy and sell bubbles along the price path, with sampled depth behind them

Executed trades

Where is trading concentrated?

Buy and sell bubbles put executed activity on the price path. Inspect bursts of trading beside the surrounding book. Every trade draws in real-time mode (free live on BTCUSDT, Pro on other live markets, open in replays); trades well above the market's typical size also draw on ordinary candles, on every plan.

Circles show received trade records. Dense retained history can group trades; zoom in for available detail.

TUT/USDT · A closer view of the same recording, 06:59 UTC

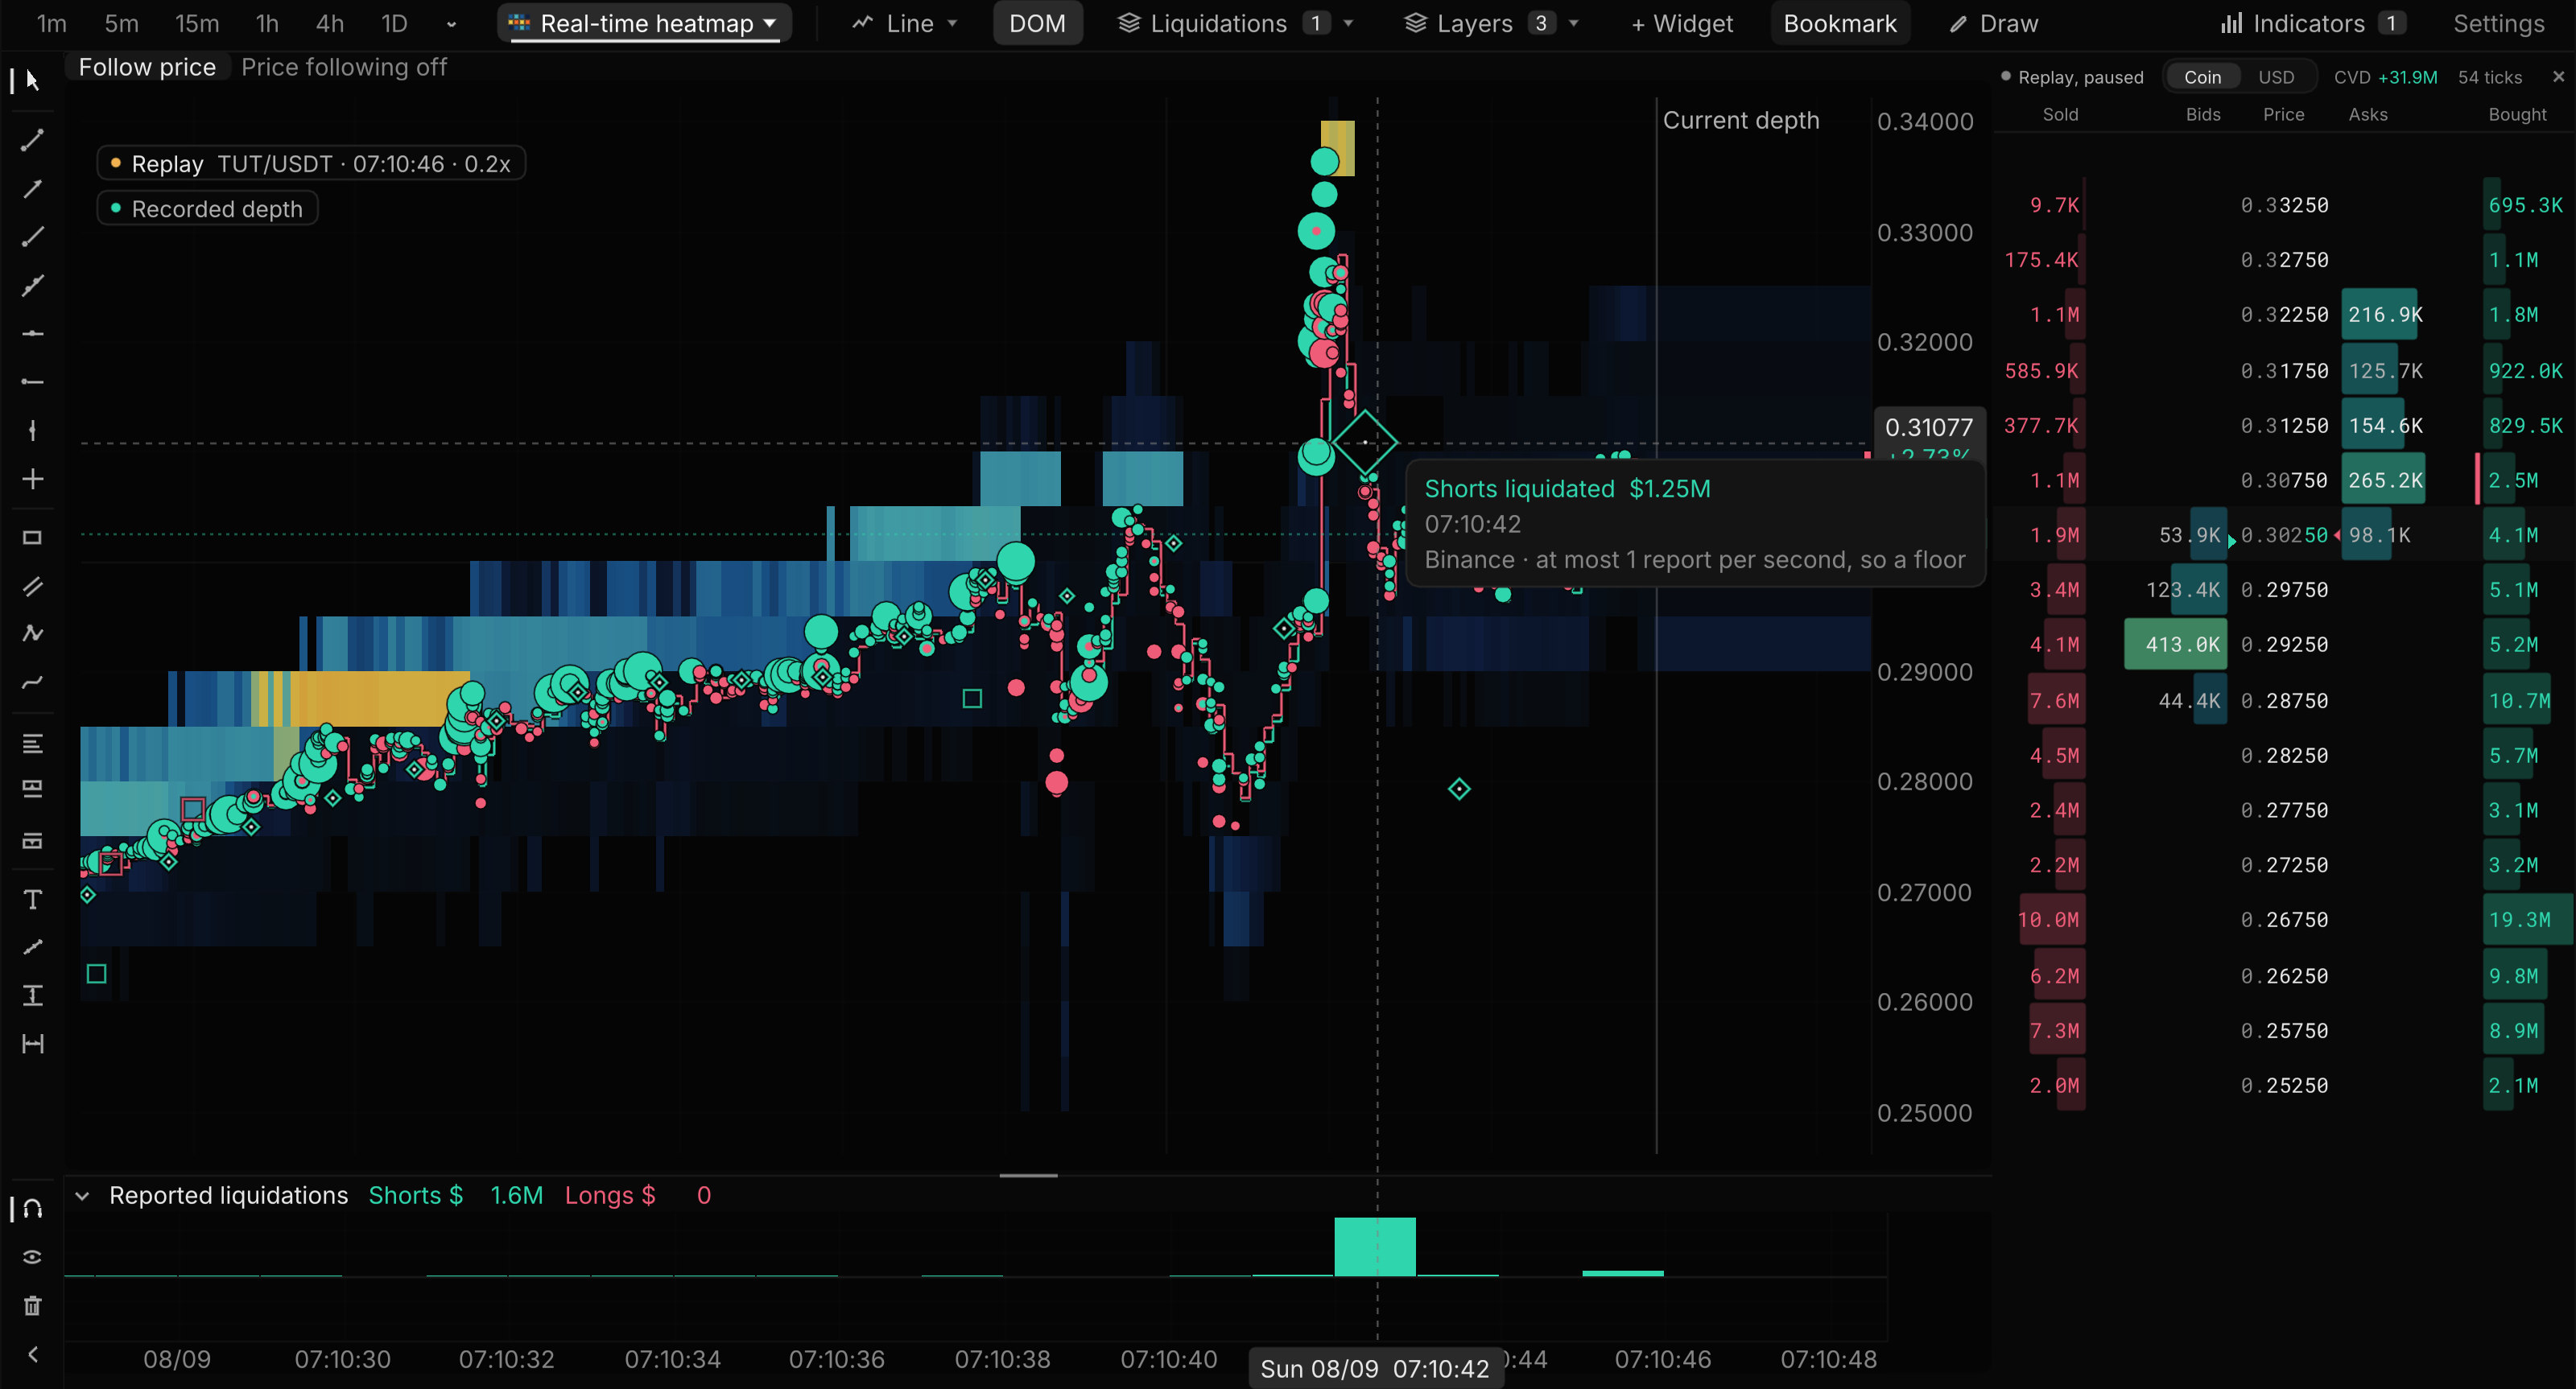
Recorded TUT/USDT in Real-time, zoomed in on the spike to about 0.34: a large reported-liquidation diamond at the 07:10:42 top with its hover reading Shorts liquidated $1.25M, 07:10:42, Binance, at most 1 report per second, so a floor; smaller diamonds along the climb, the liquidations pane showing $1.6M of shorts and no longs, and the order ladder beside

Reported liquidations

Where are liquidations reported?

Distinct diamonds mark exchange liquidation reports, and the pane below totals the shorts and longs reported each second. Hover a diamond for the exact report. Turn on Reported liquidations in the Liquidations menu; on candles, switch on Callouts on candles in its settings for dollar callouts where they run well above normal.

Binance reports are censored. Received notional is not total liquidation volume, and missing reports are not estimated.

TUT/USDT · Binance Futures · Real-time replay, 9 Aug 2026, paused at 07:10:46 UTC, hovering the 07:10:42 report

Image details above. In the terminal, depth, trade bubbles, liquidation diamonds and the activity strip have independent controls. Trade bubbles are part of the real-time view: live real-time mode is free on BTCUSDT (3 minutes a day on other markets, all day on Pro), recorded replays open it for everyone, and trades well above the market's typical size draw as bubbles on ordinary candles at no cost. Where each kind lives ↗

From watching to understanding

A fast market.
A second look.

You do not have to learn everything in the moment. Revisit captured session history, or open a covered recording and work through it at your own pace.

Try a recorded replay
About this recording and transcript

This silent recording shows real TUT/USDT market data replayed in the local terminal. Horizontal bands show sampled resting depth. Buy and sell circles show executed activity; at this zoom, dense history is grouped. The linked DOM updates beside the chart. The replay runs at 1×. It is one recorded example, not a forecast or a study result.

  1. 01

    Notice it live

    Follow how the book and trading change together. Find a moment you want to understand.

  2. 02

    Revisit the sequence

    Pause a covered replay. Inspect the lead-in, then advance to see what happened next.

  3. 03

    Practice your reading

    Review another case. Turn an observation into a specific question you can test in Research.

The data behind the view

Know what you are looking at.

Real observations, with their limits kept visible.

Check available coverage ↗
Depth & trades

Depth is sampled. Dense trade history can be grouped, and unavailable depth remains a gap. Resting orders are not a promise to trade.

Liquidation reports

Diamonds and the strip show received exchange reports, not a complete liquidation census. Binance reports are throttled and completeness is unknown. A diamond does not identify one particular trade bubble as a liquidation.

Session history & replay

Captured session history and recorded replay are separate sources. Replay depends on market coverage and plan access. Liquidations include only retained or delivered reports; opening a chart does not backfill earlier liquidation events. Research history and tick replay have different coverage.

Binance liquidation reports are censored. Replay availability varies by market and plan.

Read the sequence for yourself

Put the move in context.

Open a market. Switch on Real-time, the pill beside the timeframes. Start with the book and trades, then add the layers that answer your question.

Binance USDT-M perpetuals, from majors to smaller markets.
Live real-time mode: free all day on Binance Futures BTCUSDT and 3 minutes a day on other markets; all day everywhere on Pro or Research. Large-print bubbles on candles and recorded replays: every plan.