Worked examples
Setups
vs the record.
One chart is an example. A denominator is evidence. Each lesson replays a real recorded occurrence tick by tick, then shows how often that setup actually worked across every occurrence in the record, with the count and its denominator. Then you re-run it yourself.

A VPIN spike is a warning, not a direction
27% rose 2%+ · 36% fell 2%+ over 24h · 40% drew down 5%+ first
Anatomy of a clustered liquidation cascade
27% rose 2%+ · 39% fell 2%+ over 24h · 43% drew down 5%+ first
The sweep-and-reclaim reversal is a coin flip
28% rose 2%+ · 29% fell 2%+ over 24h · 25% drew down 5%+ first
Extreme funding into settlement: the crowd pays to bleed
22% rose 2%+ · 61% fell 2%+ over 24h · 71% drew down 5%+ first
Aggressive buying and whale prints: who is selling to them?
18% rose 2%+ · 23% fell 2%+ over 24h · 17% drew down 5%+ first
Occurrences are observed examples in the scanned record, not a guarantee. Nothing here is trading advice.
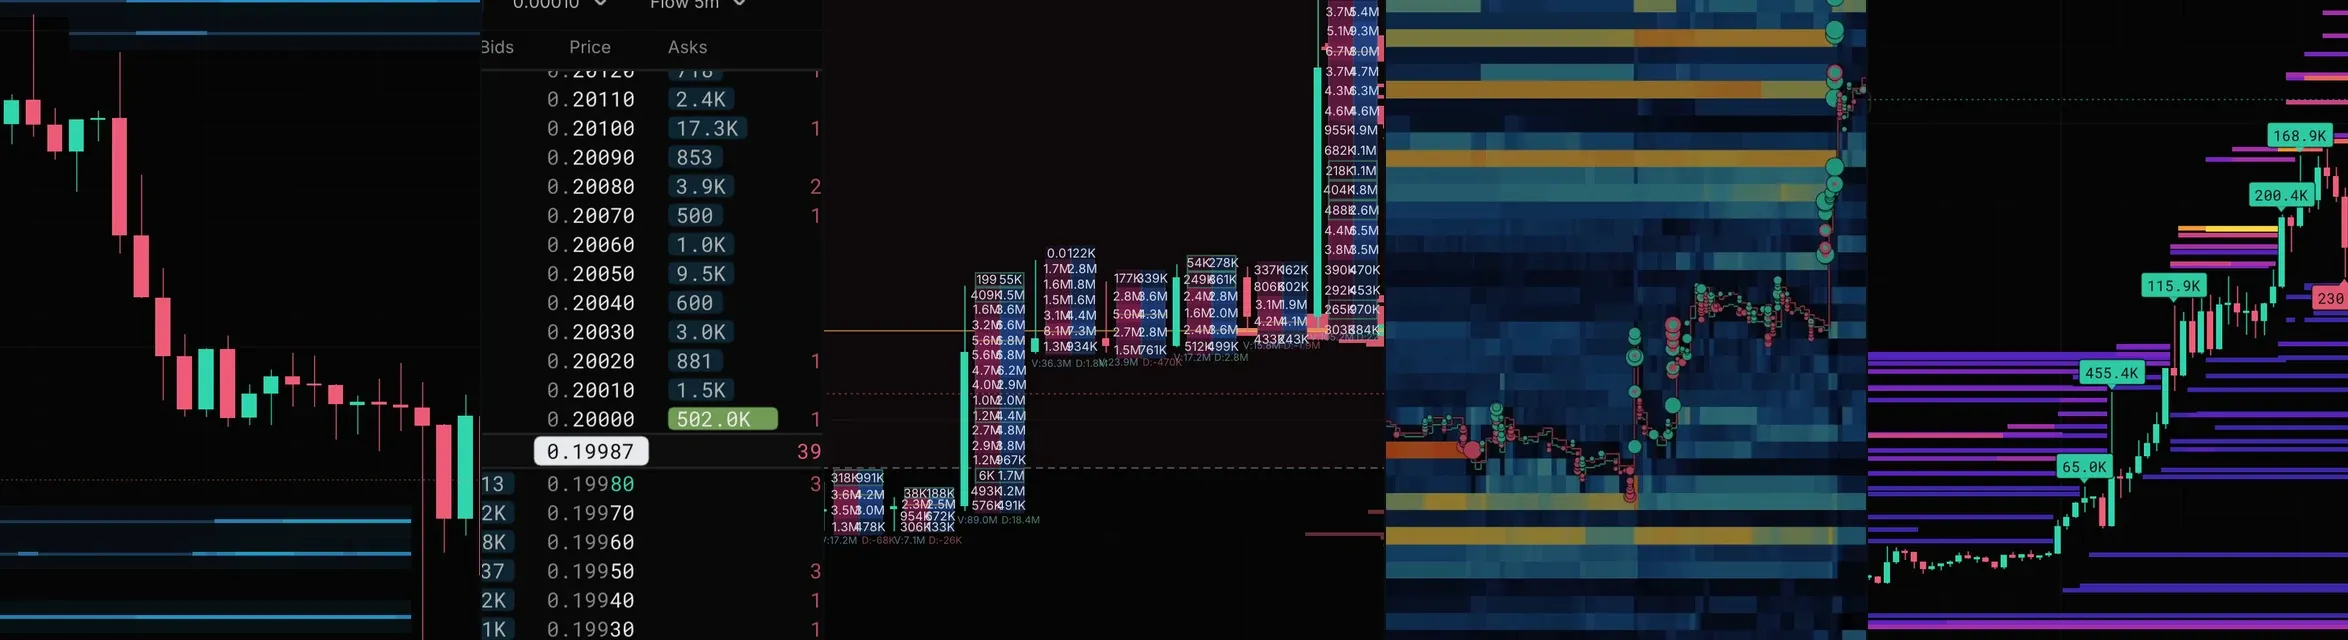
Stop guessing from one chart. Test the setup against every occurrence.
Describe a setup in plain English and get every time it happened, with the denominator, then replay any of them.
FREE TO READ · EVERY COUNT HAS A DENOMINATOR · RE-RUN IT YOURSELF