Anatomy of a clustered liquidation cascade
Liquidation intensity measures how much forced selling is hitting; the cascade-clustering index measures whether those liquidations arrive together (a chain reaction) or scattered. High on both is the cascade set-up: positions force-selling into each other.
- 24h forward, of 384 with a computable horizon
- 27% rose 2%+ · 39% fell 2%+
- Bigger moves
- 15% rose 5%+ · 23% fell 5%+
- Drawdown first, of 392 with a computable horizon
- 43% drew down 5%+ · 20% drew down 10%+
A clustered cascade opens a high-volatility regime with a downside lean: big moves both ways, frequent deep drawdowns, and a bounce that is real sometimes but far from reliable. Trade the volatility, not a guaranteed direction.
Watch it happen, call it, then meet the denominator.
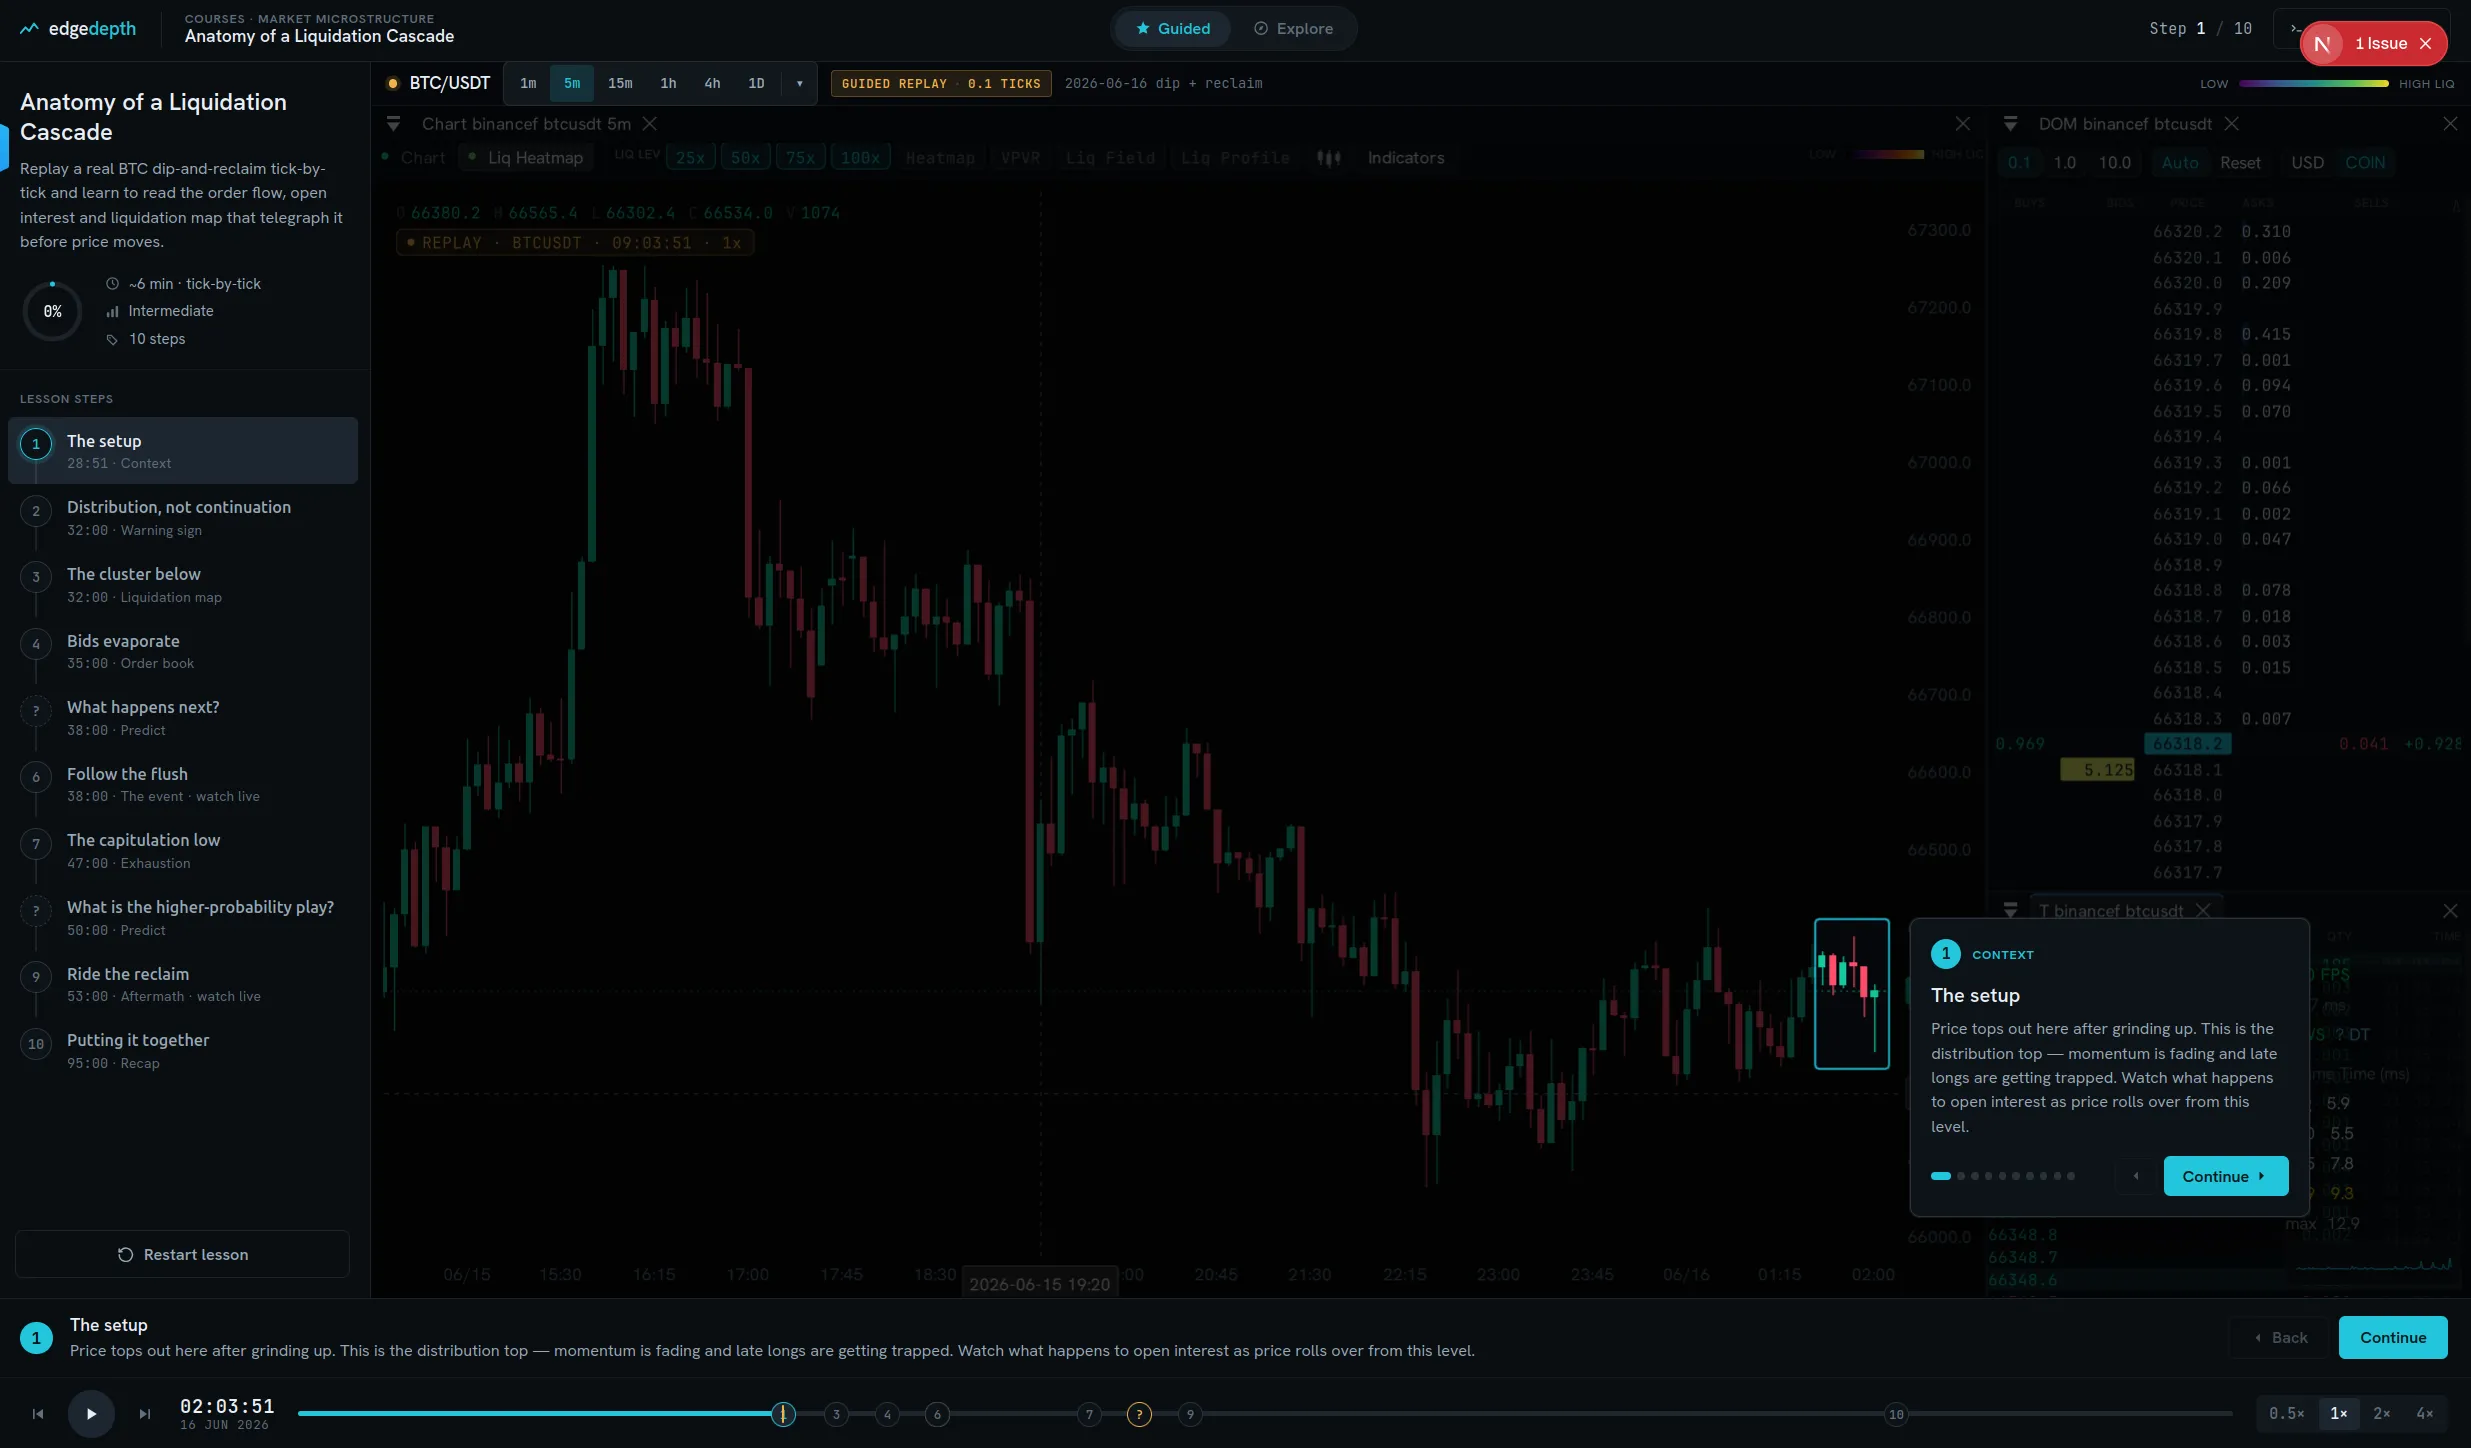
The guided replay drops you into a real occurrence of this setup and plays it tick by tick: the order book, the tape, the liquidations. You watch the setup form, then you call the next move before the market answers.
Then the lesson does the thing a single chart never can: it shows you the base rate across every occurrence, with its denominator, so the one persuasive example is put back in its distribution. That gap, between the chart and the count, is the whole point.
Does your setup actually work?
Find out before you fund it.
Describe it in plain English, get every time it happened with the denominator, and replay any of them.