Aggressive buying and whale prints: who is selling to them?
When most of the traded volume is lifting the offer and a large share of it comes from whale-sized prints, the tape screams up. But every aggressive buy is somebody else's sell. We measured every occurrence to see who wins that exchange.
- 24h forward, of 1,465 with a computable horizon
- 18% rose 2%+ · 23% fell 2%+
- Bigger moves
- 5% rose 5%+ · 9% fell 5%+
- Drawdown first, of 1,505 with a computable horizon
- 17% drew down 5%+ · 3% drew down 10%+
The most bullish-feeling setup in the set, and across every occurrence it leaned slightly the other way. Heavy taker-buying into whale-sized offers is often distribution: the size filling the aggressors is the informed side. When the tape feels most one-sided, ask who is calmly filling it.
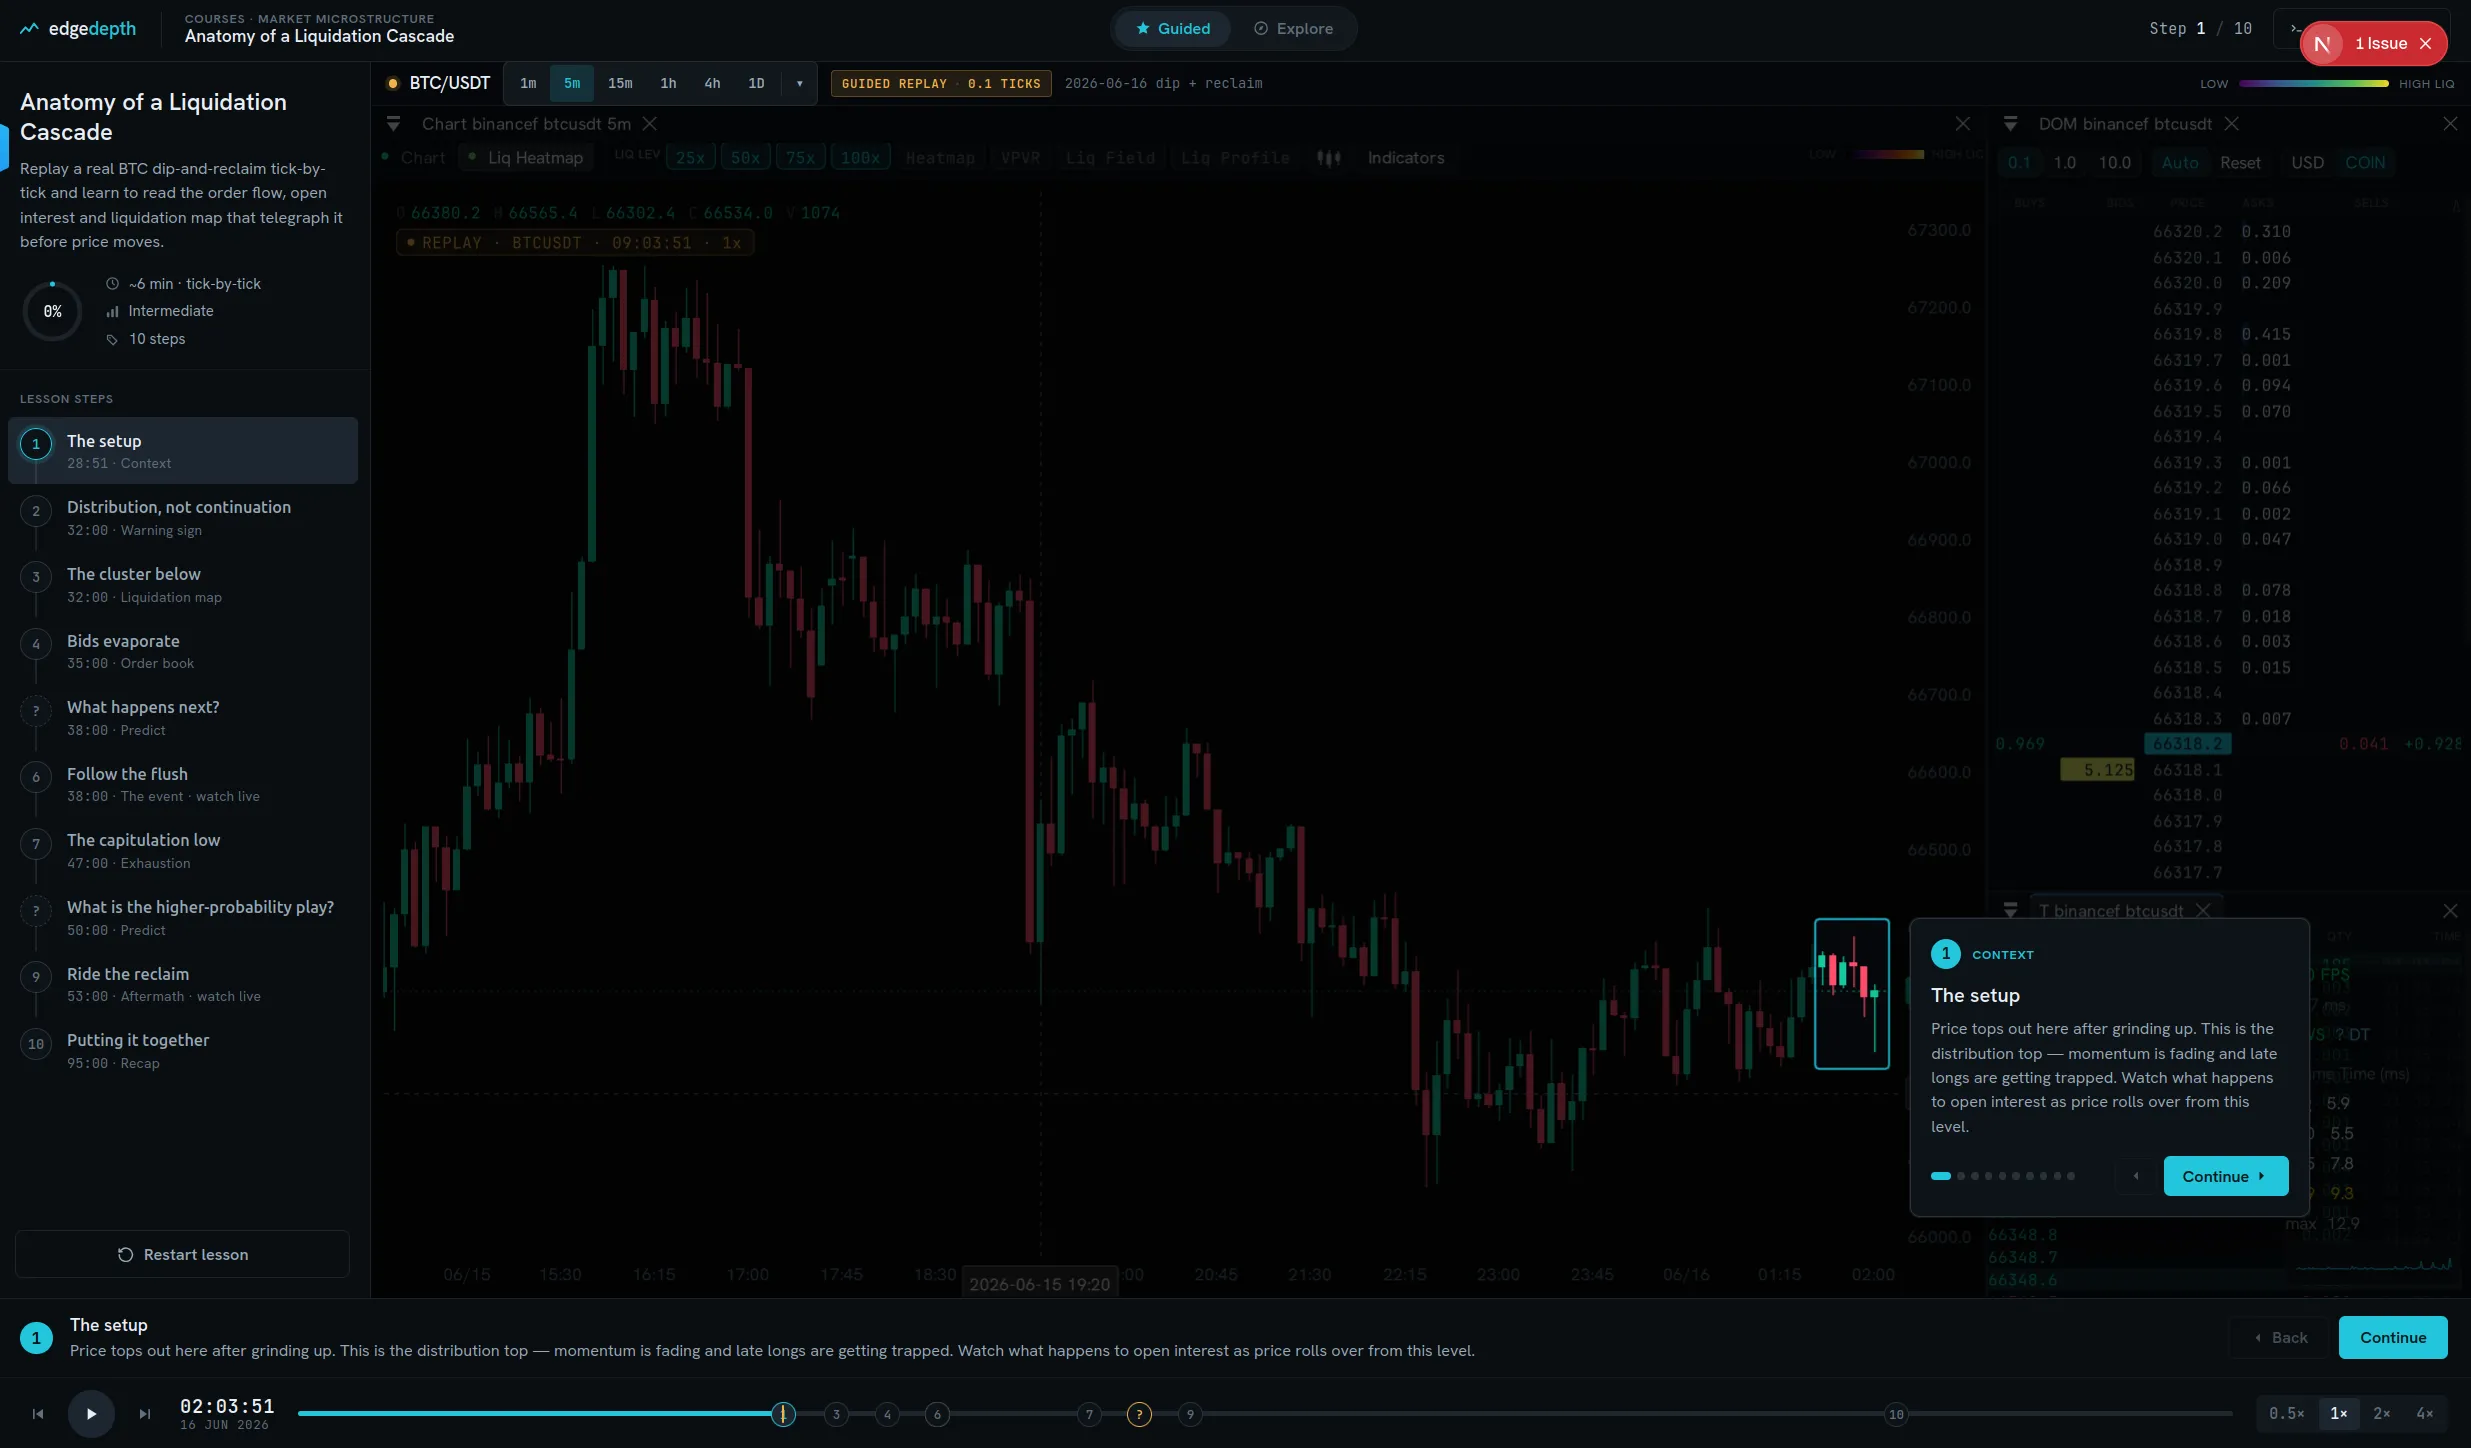
Watch it happen, call it, then meet the denominator.
The guided replay drops you into a real occurrence of this setup and plays it tick by tick: the order book, the tape, the liquidations. You watch the setup form, then you call the next move before the market answers.
Then the lesson does the thing a single chart never can: it shows you the base rate across every occurrence, with its denominator, so the one persuasive example is put back in its distribution. That gap, between the chart and the count, is the whole point.
Does your setup actually work?
Find out before you fund it.
Describe it in plain English, get every time it happened with the denominator, and replay any of them.