Your market, in context
Your perp markets.
One order-flow workspace.
Keep price, liquidity, trades and positioning together across Binance Futures, Hyperliquid and Bybit. Build the view you need, then return to recorded Binance moments for a closer look.
Live Binance USDT-M, Hyperliquid and Bybit perpetuals · Features vary by plan
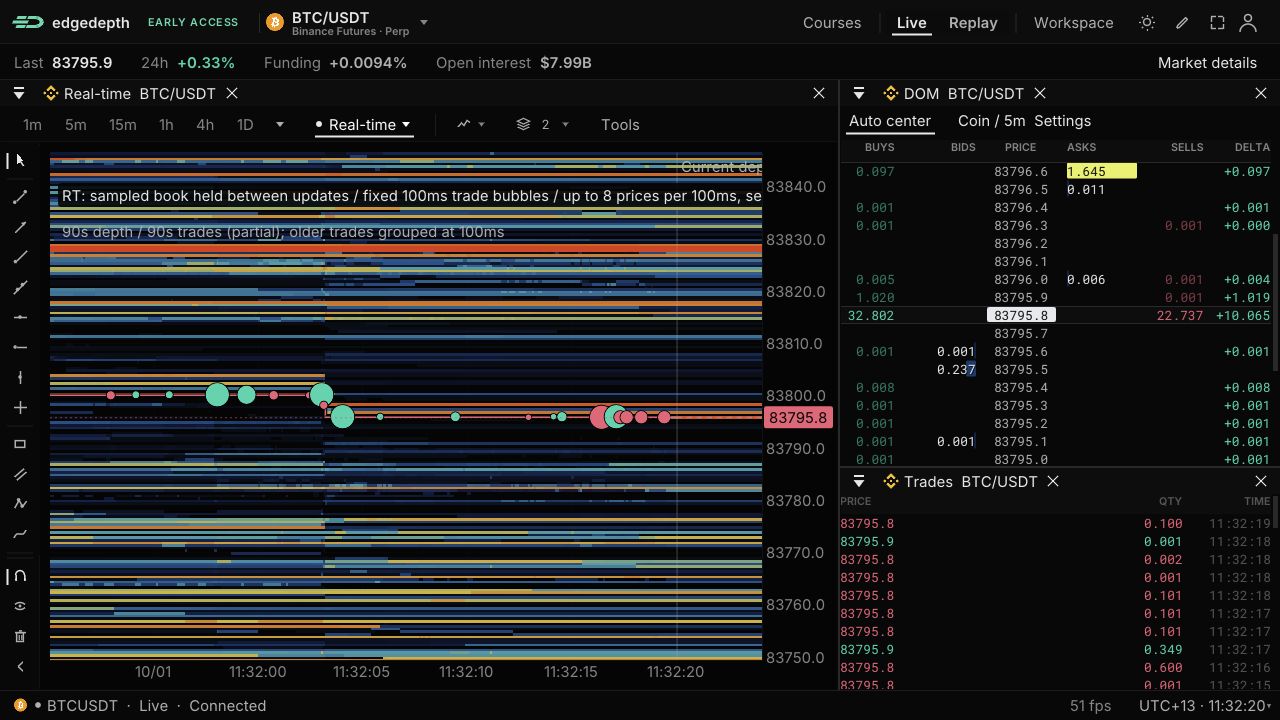
BTC/USDT · Binance Futures · Live production capture, 1 Oct 2026, 11:32 NZDT (30 Sep, 22:32 UTC). Real-time chart, DOM and tape; depth is sampled and trade history can be grouped. · Select image for full capture
- 01
Follow the price
Switch between candles, footprints and profiles to examine the same market from different angles.
- 02
Read the book
Keep the DOM beside the chart. Compare bids, asks, buys, sells and delta at each price.
- 03
Watch the trading
Use the tape and trade bubbles to inspect executed activity alongside resting orders.
Follow the sequence
Bring the order flow into focus.
RT places sampled resting depth and trade bubbles on one time and price axis. Add reported liquidation context when it helps answer your question.
Explore real-time order flow ↗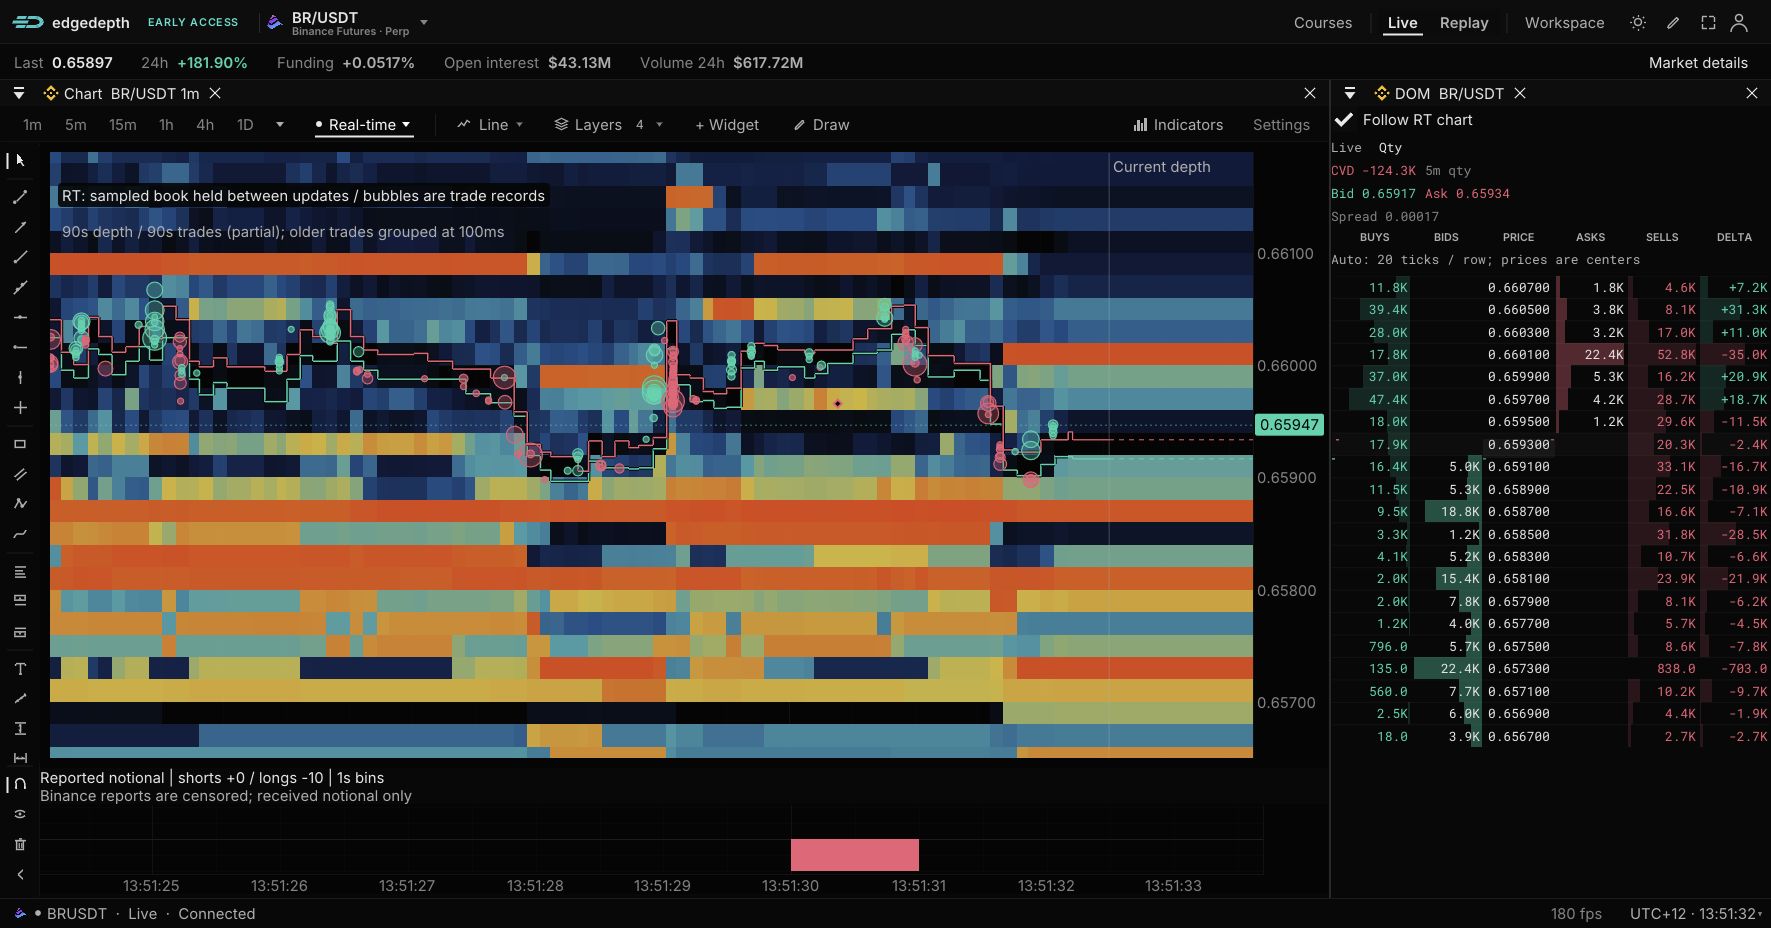
TUT/USDT · Binance Futures · Recorded depth and trades, 9 Aug 2026
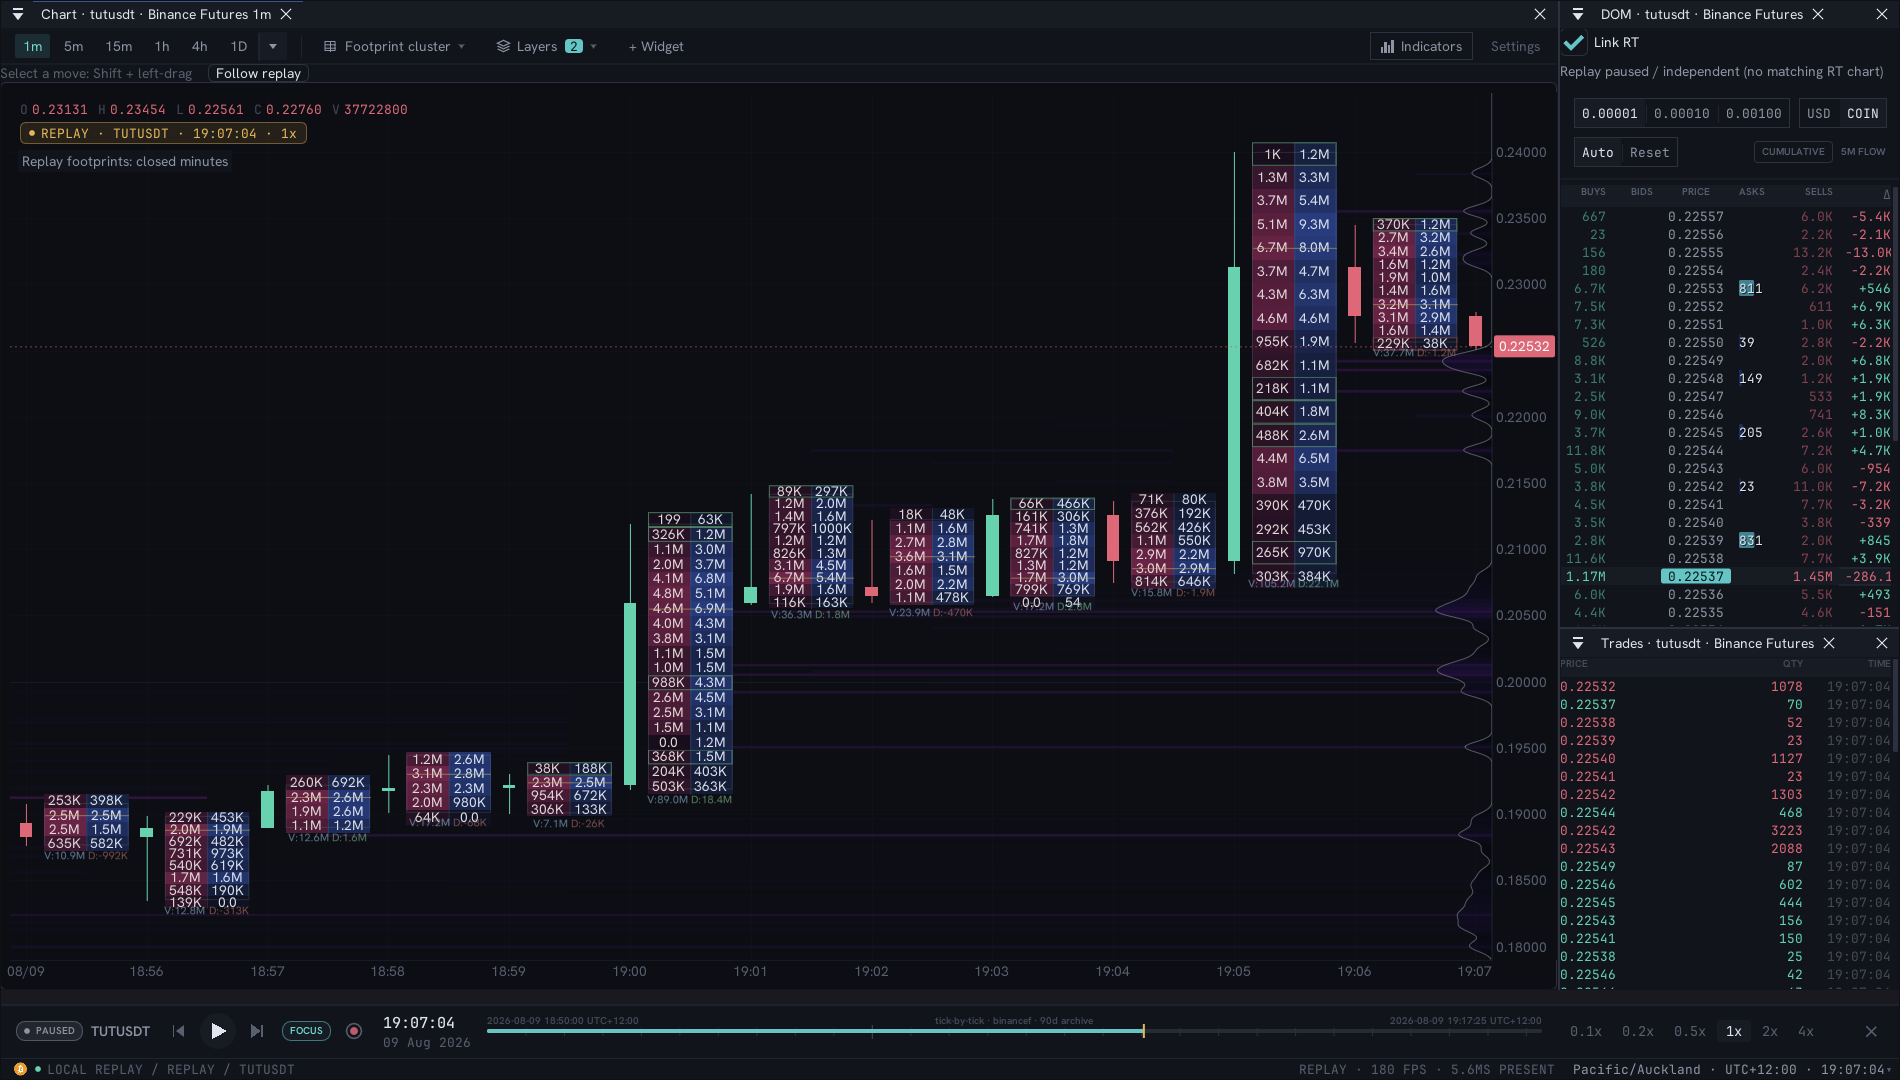
TUT/USDT · A detail from the same closed-minute footprint capture
Choose your perspective
A closer look at the trading.
Footprints show buy and sell volume at each traded price. Compare activity inside closed candles while keeping the book and tape nearby.
Explore recorded replay ↗Live access and plans
Start free without a card. Hosted live RT, sub-minute candles and advanced liquidation layers require Pro or Research. Recorded replay and research have separate coverage and plan limits.
Data and rendering
Depth is sampled; dense RT history can group trades. Resting orders can change or cancel. Frame rate depends on hardware, browser, viewport, data load and enabled layers.
From observation to investigation
On supported loaded Binance candles, Shift-drag a move, then right-click and choose Investigate this move. Review the proposed scope on the investigation page. A visual pattern is a question to test, not a trade signal.
Coverage and plan access vary. Compare plans · See what is in development
Explore it for yourself
Build a view you can read.
Open a market and bring its chart, book and trades together.
Live Binance USDT-M, Hyperliquid and Bybit perpetuals · Features vary by plan