A coin just moved. Want to know why? Go back to that second and see the order book, every trade and the liquidations for yourself. Pause, rewind, slow it down.
A silent 35-second loop filmed on the EdgeDepth terminal, STRK/USDT on Binance Futures, 11 October 2026. Live: one-minute candles with large-trade bubbles and dollar callouts for reported liquidations, the order book, and the trade tape with its buy and sell pressure bar. Caption: Live order flow. Ready to replay. A right-click on the 01:36 UTC candle opens the chart menu and Replay from here is chosen. Caption: Replay any supported market, with the Binance, Hyperliquid and Bybit marks, then Up to 30 days of Binance replay on Pro. The recorded replay plays from 01:36:52 UTC at 1×: the 01:36 candle jumps from about 0.1086 to 0.1158 within five seconds while the tape fills with buys. Later in the same replay it is paused at 01:39:28, rewound to 01:36:28 on the timeline, slowed to 0.5× and switched to the Real-time view. Caption: Pause. Rewind. Slow it down. In Real-time the recorded book and every trade play on one clock as price climbs through the resting offers. Caption: See the order flow behind the move. After the move, diamonds mark reported liquidations on the tape and the pane below totals the shorts reported each second. Caption: See the shorts forced out. Live and in replay. Caption: Watch live. Replay with context. Try live depth on BTC for free. Only waiting is trimmed (a tooltip, page and seek loading, a paused hold, and 4 seconds of market time while the Real-time view rescaled); nothing is sped up. Real recorded data; not a forecast.
670markets recorded
3venues, live and recorded
30daysof Binance replay on Pro
7daysof archived moves, free to replay
Why EdgeDepth
Go back to the second it moved. On every Binance perp.
Tick by tick, not bar by bar: the order book, every trade and the liquidations as they were. We only do crypto perps, so every Binance perp is recorded, plus Hyperliquid and Bybit, with funding and open interest on the same screen.
Free: Bitcoin's past 3 days and any archived move from the past 7 days. Pro: up to 30 days of replay on every Binance market.STRK/USDT · Binance Futures 1m · 11 Oct 2026 · Right-click on the 01:36 UTC candle, Replay from here, then the recorded replay at 1×
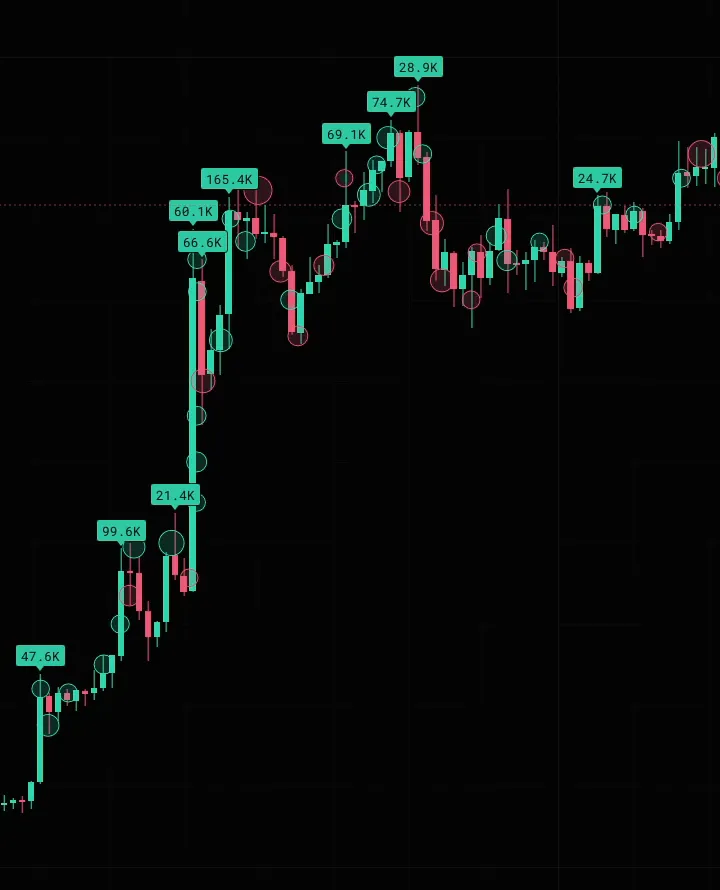
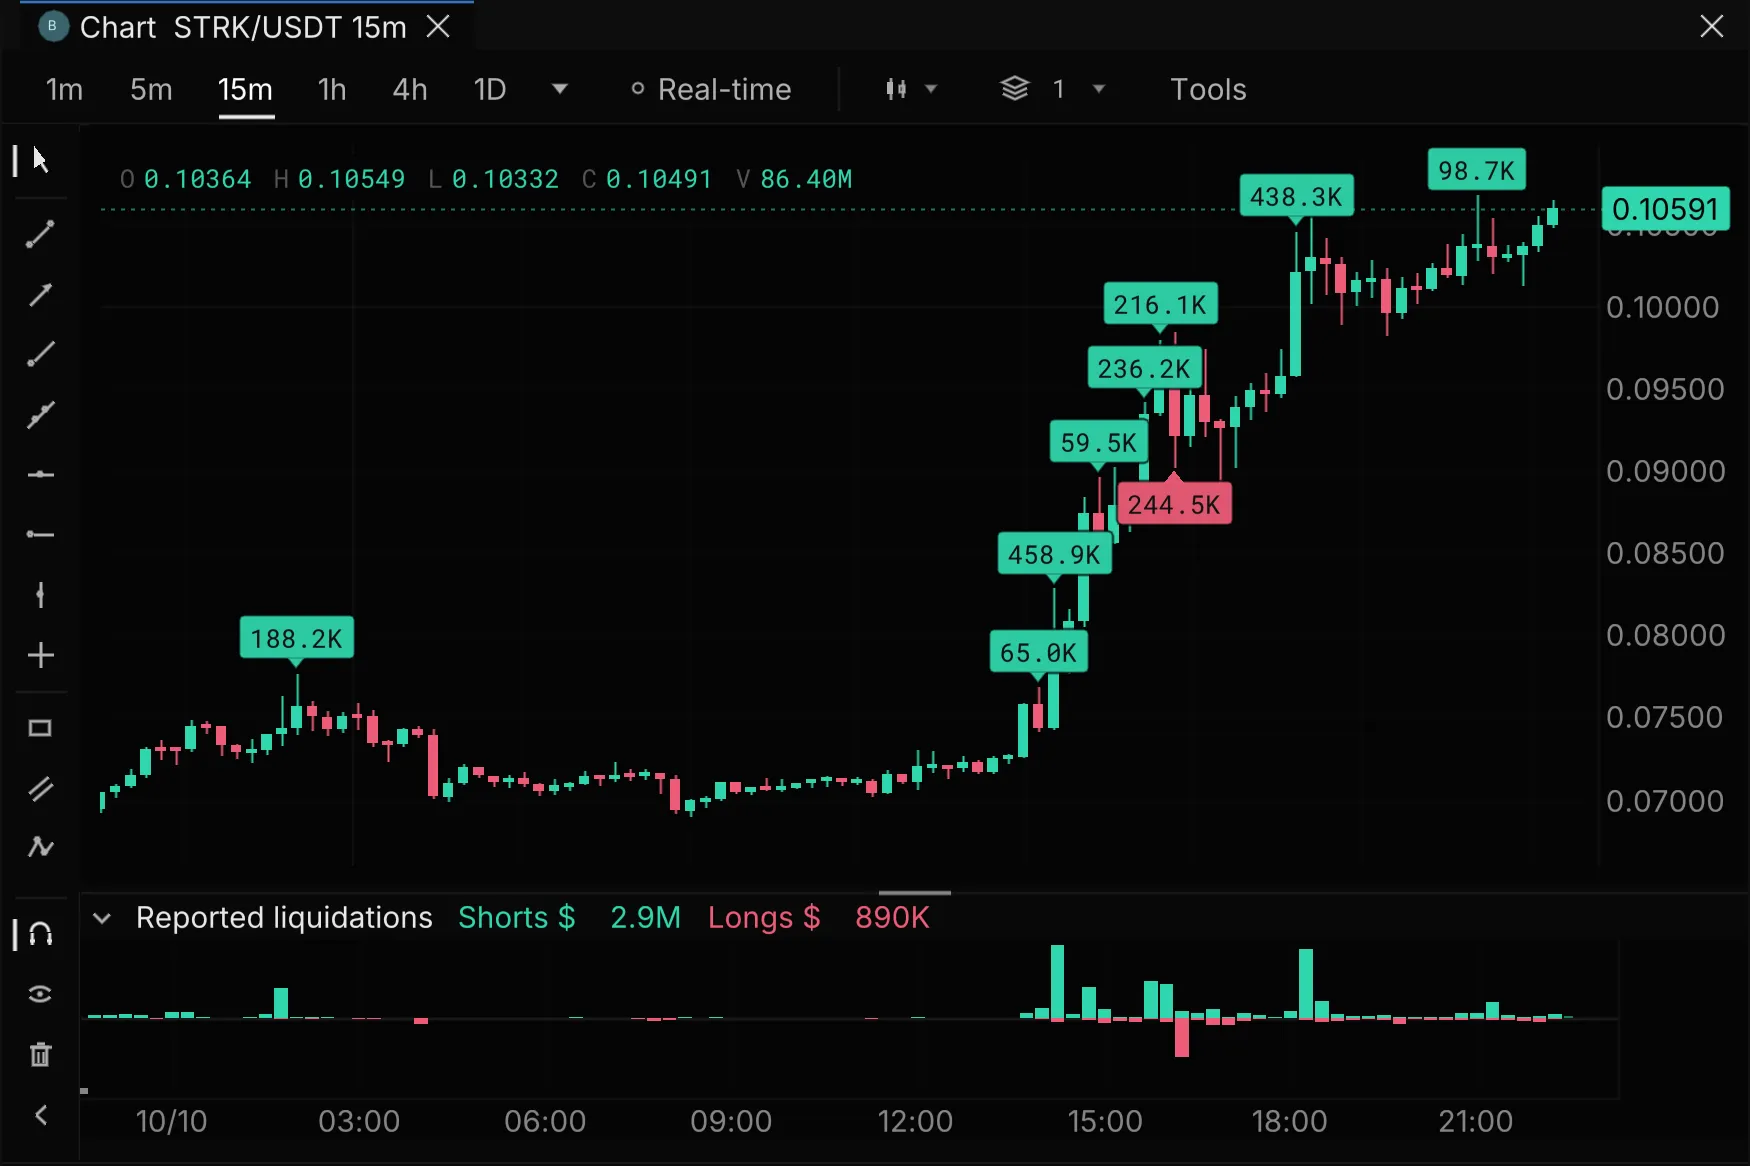
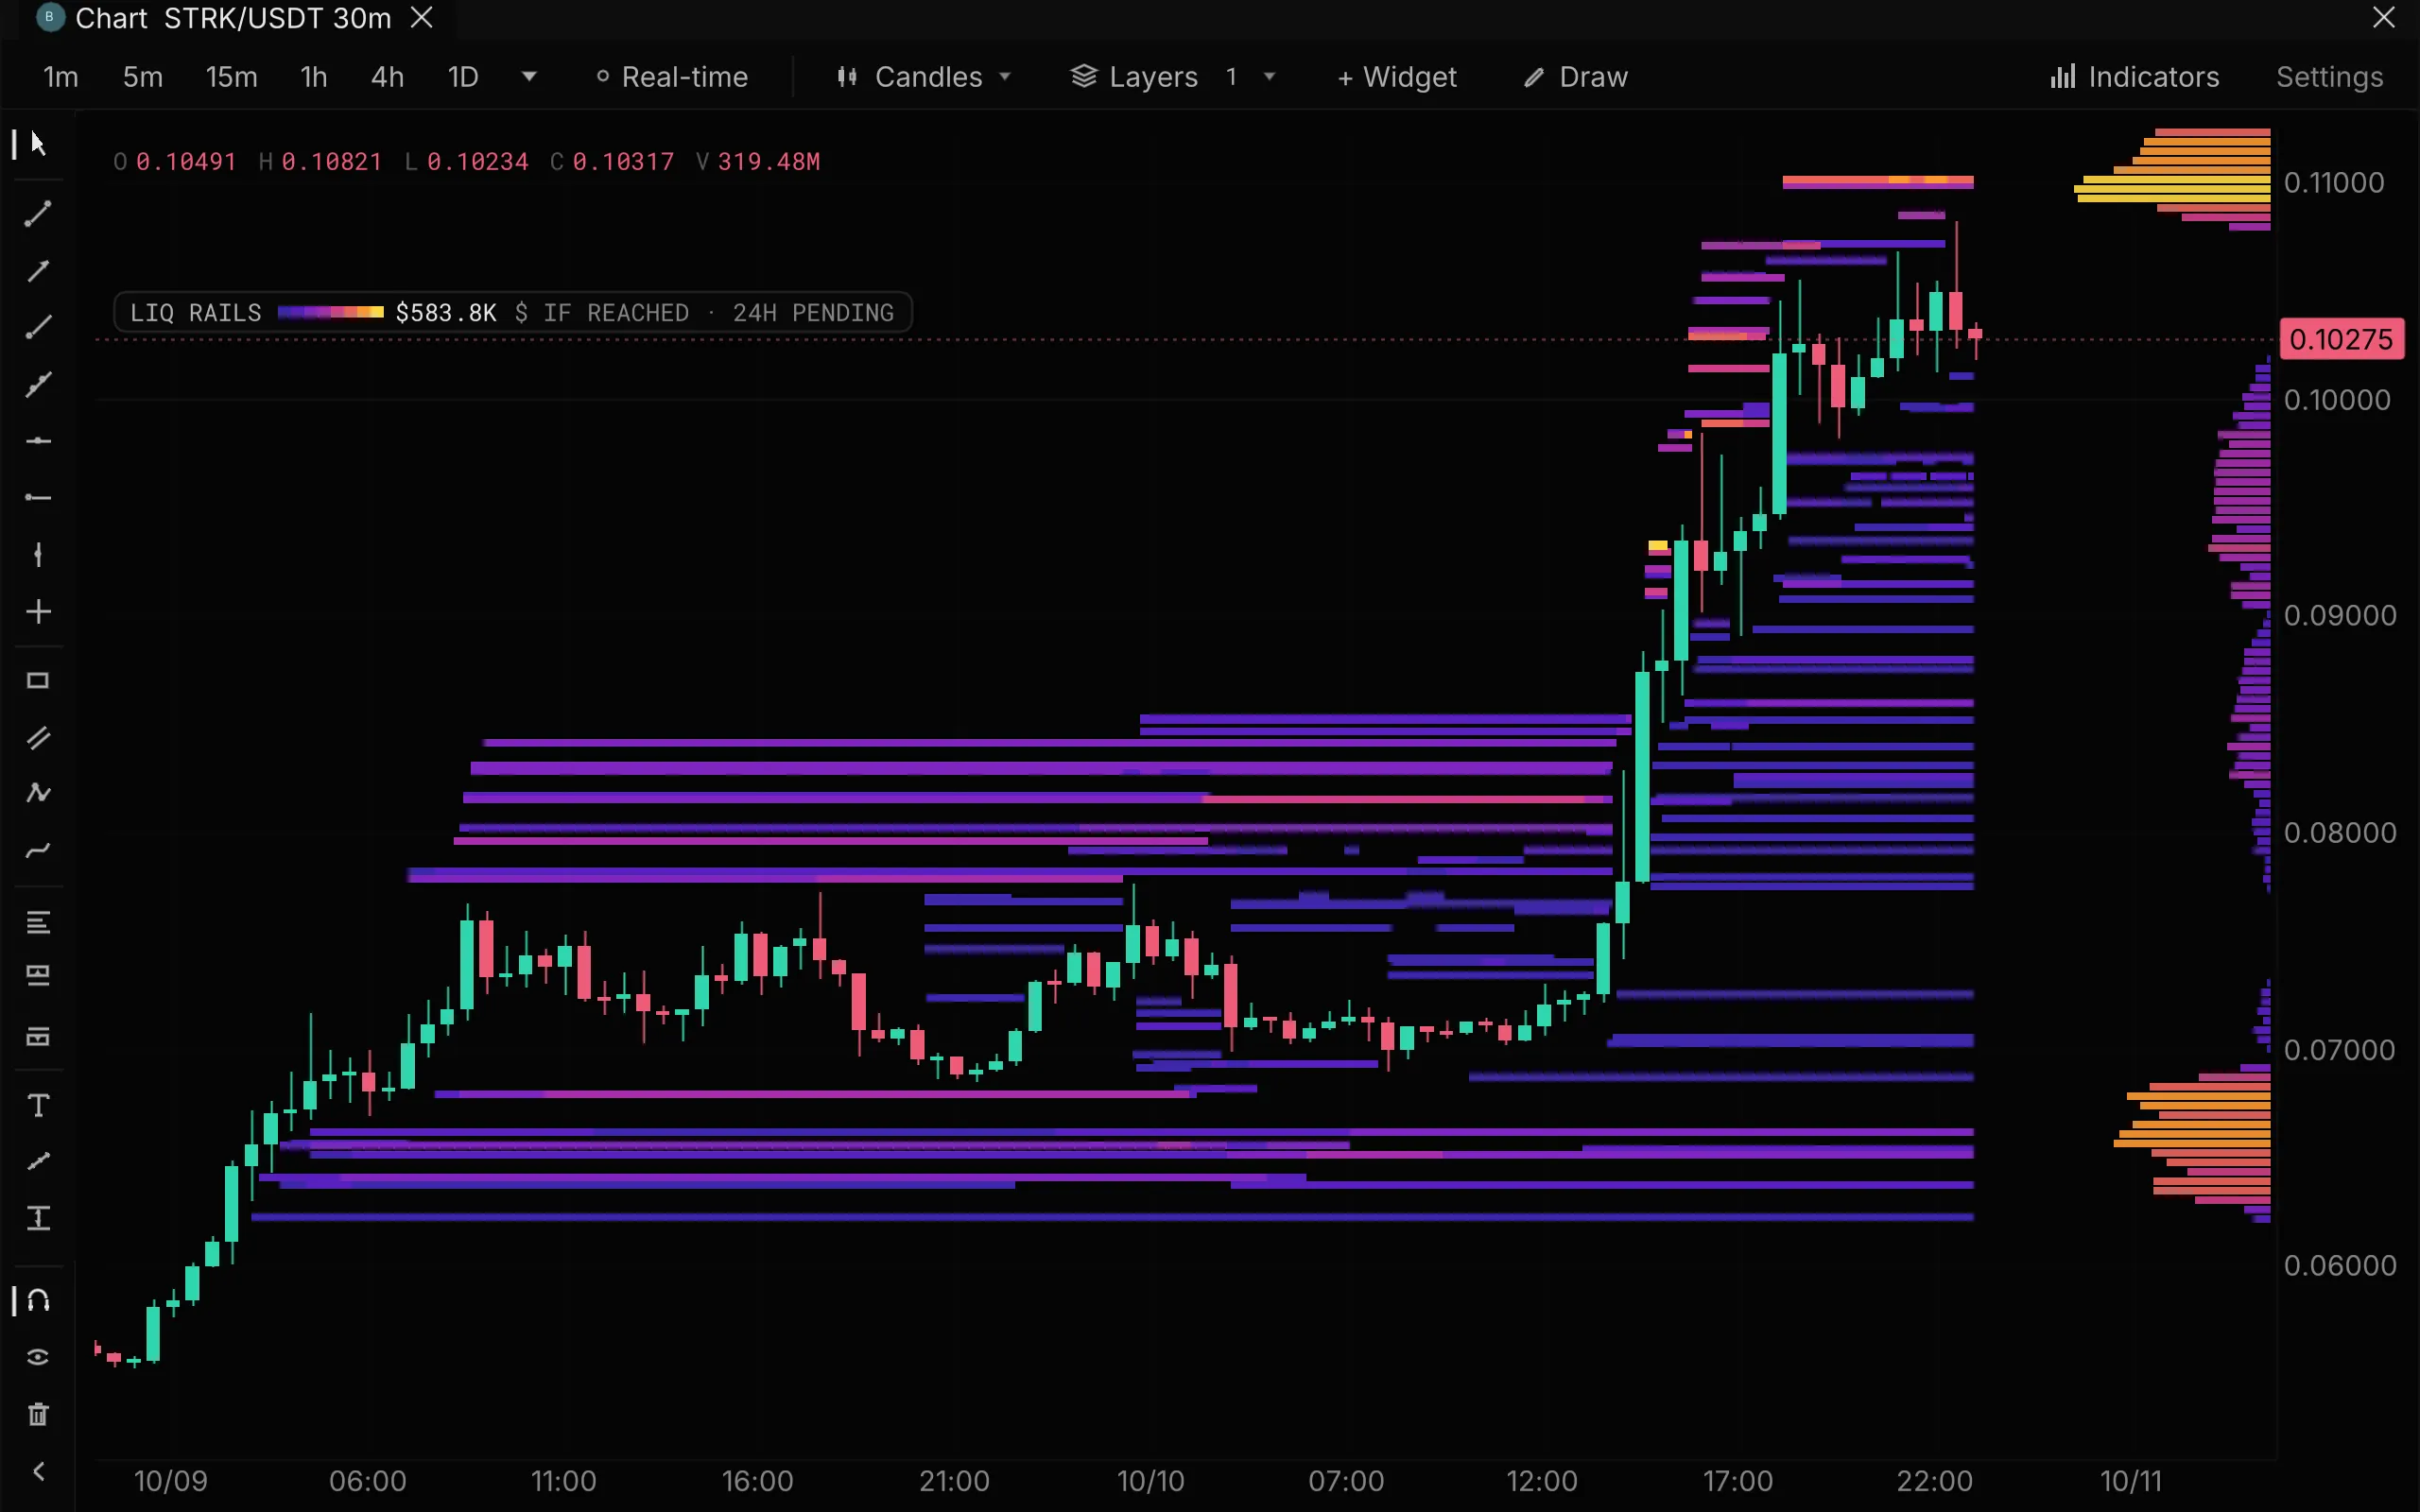
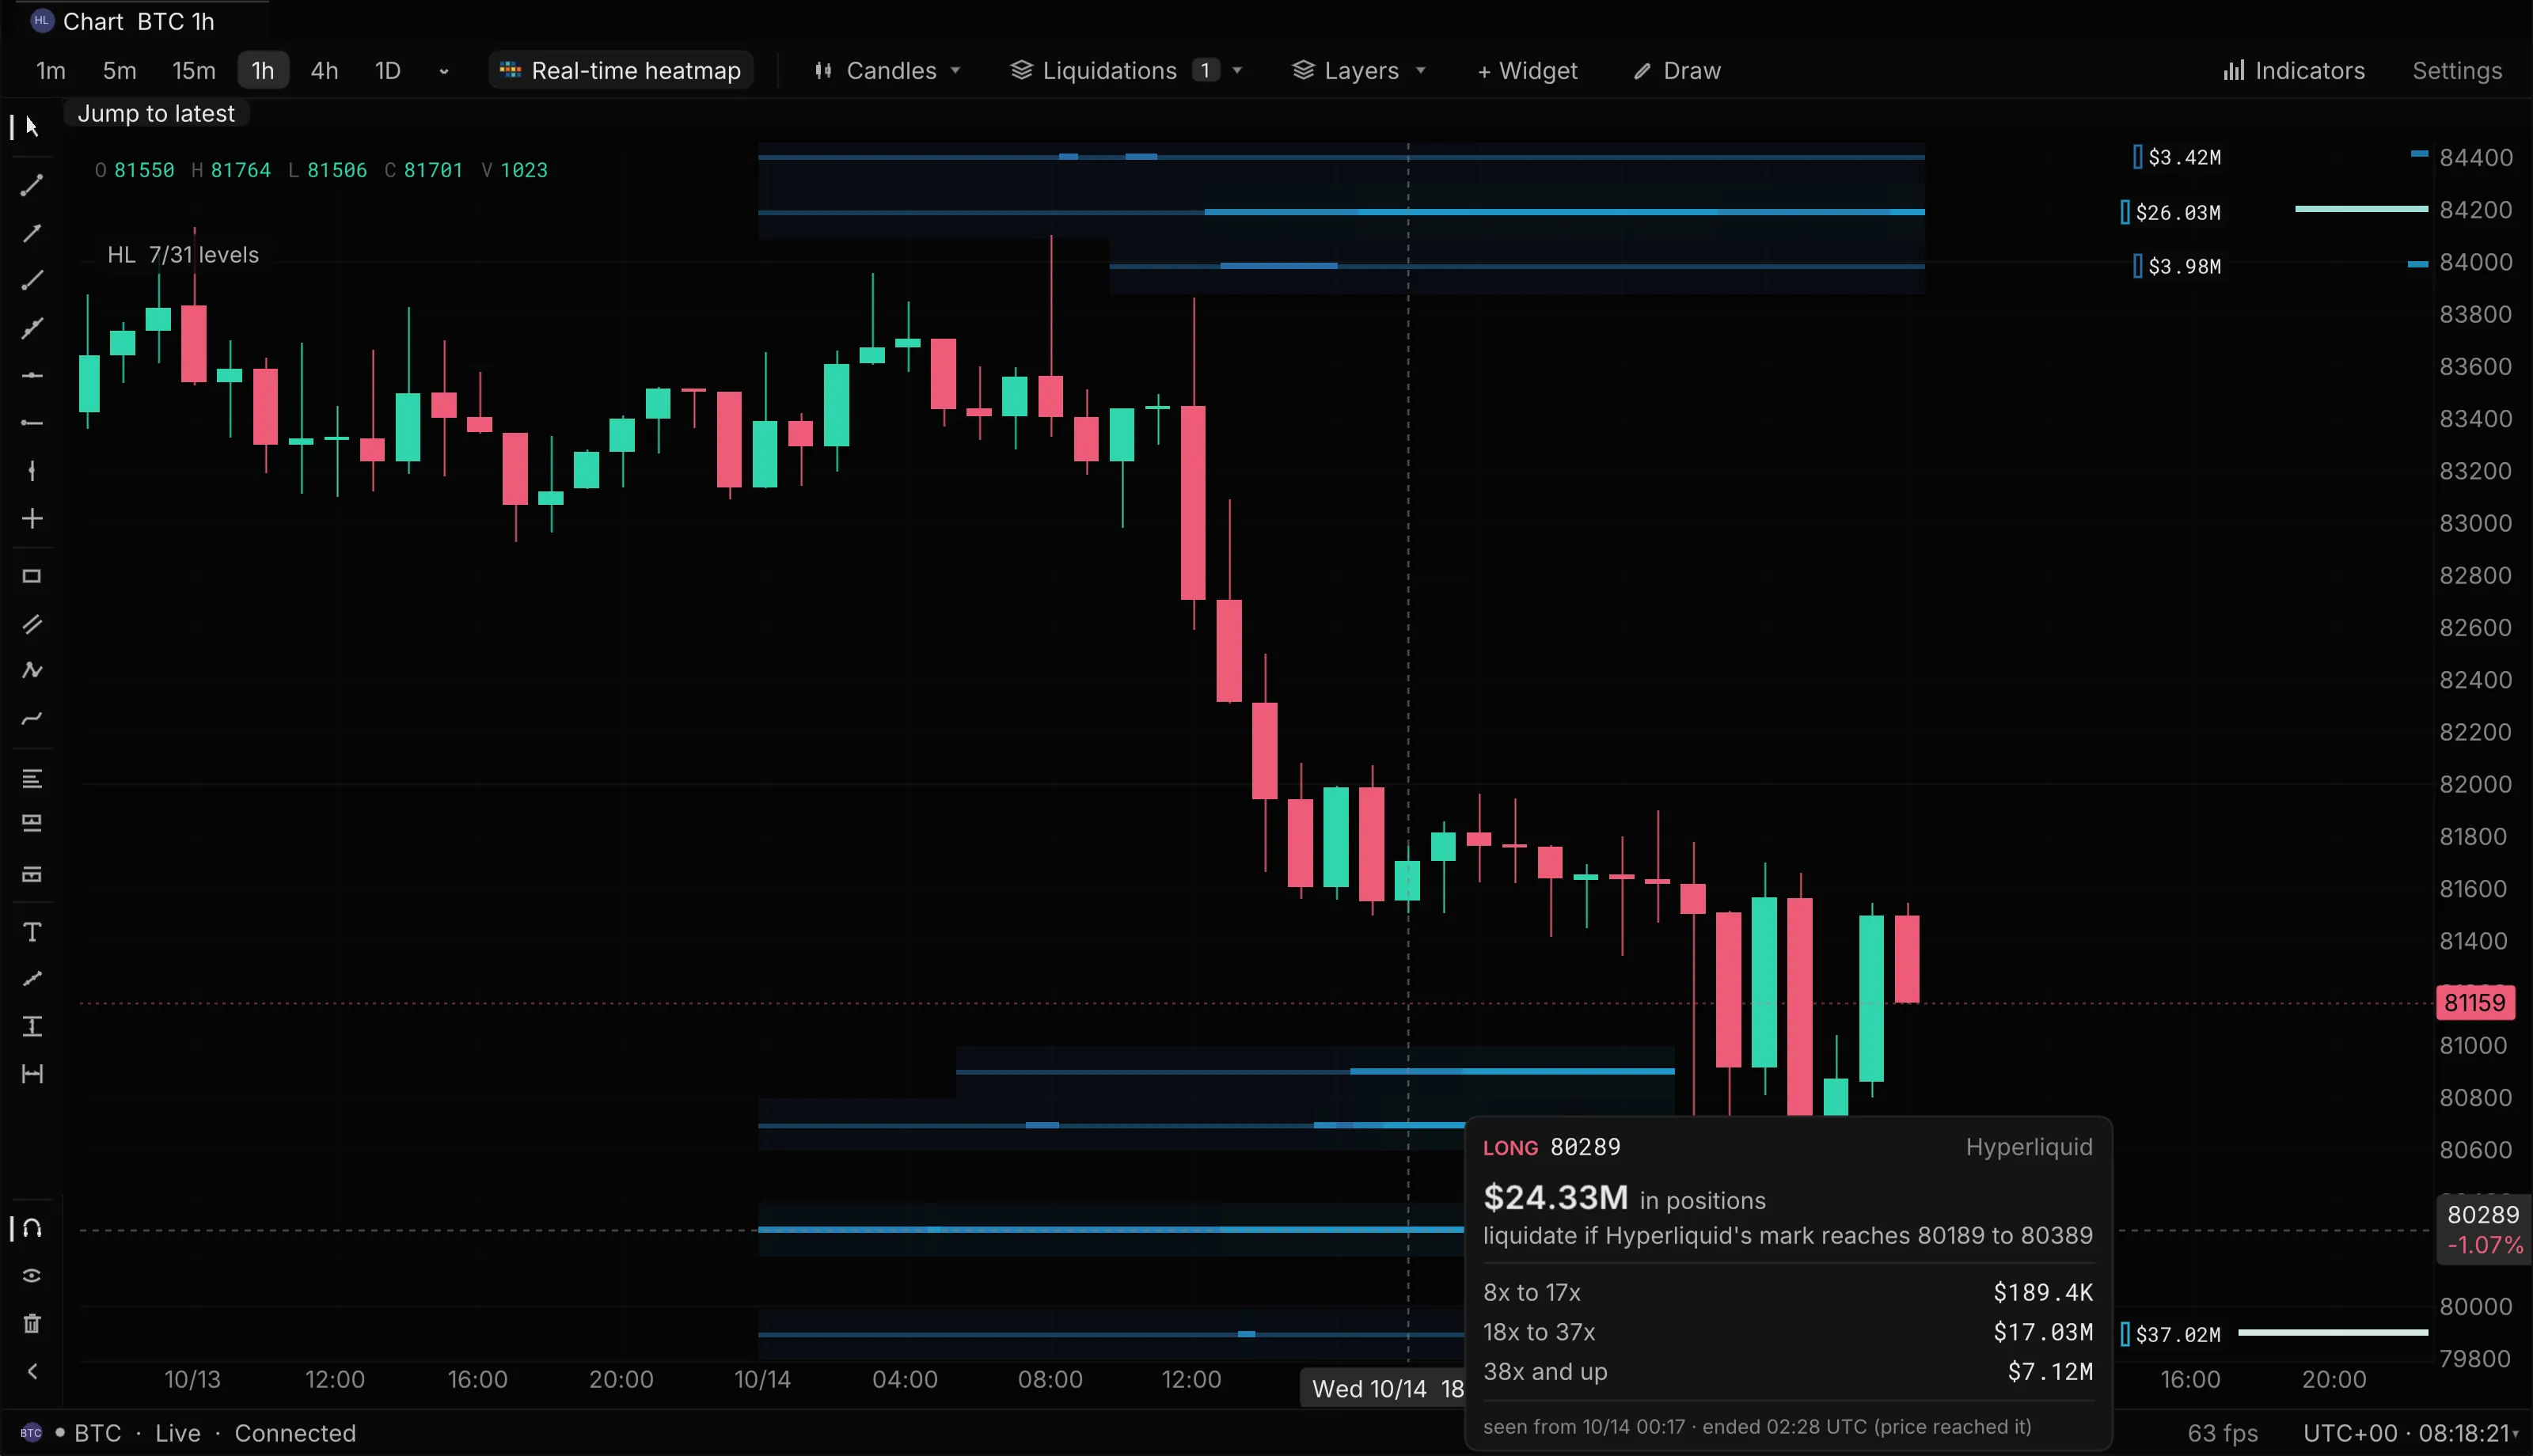
Pro on every market.What Binance published, at most one report per second, so totals are a floor.STRK/USDT · Binance Futures 15m · 10 Oct 2026 · Callouts on candles with unusually large reports; the pane totals each candleFree on Bitcoin, Pro elsewhere.Estimates from a model, not known positions. Scored every day; the forward test reports from 16 Nov.STRK/USDT · Binance Futures 30m · Rails from Binance and Bybit · Live chart of real recorded data, 9 to 10 Oct 2026Free on Bitcoin, Pro on every other coin.Positions read from our own Hyperliquid node, at their real liquidation prices.BTC/USDC · Hyperliquid 1h · 15 Oct 2026, 08:18 UTC · Hovering the long rail at 80,289
Try it: pause, rewind, half speed
07:10:21.6 UTC
TUT/USDT · Binance Futures · Real-time replay, 9 Aug 2026 · Filmed in the terminal at 0.2× and shown at market speed; the controls play the film
BTC/USDT · Binance Futures · 5 to 12 Oct 2026 · 8 scored days
9%
of the time, price sat at our BTC levelsabout 15 of 172 hours scored
64%
of the liquidated dollars came in those minutes$197.76M of $308.58M reported
7.2×the average rate of liquidated dollars, while price sat at our levels
Price at our levelsEverywhere else
We checked 11 liquidation map and heatmap tools on 4 October 2026. None published how often its levels met real liquidations.
01Only perps
Replay any perp, even the move you missed
Every Binance perp is recorded tick by tick on our servers, around the clock, with Hyperliquid and Bybit too. When an alt runs while you are away, scroll back and replay it from the candle you right-click.
Perps move on forced orders, so liquidations are core data here: what the exchange reported, where rails estimate positions would break, and on Hyperliquid the real liquidation prices of positions read from our own node.
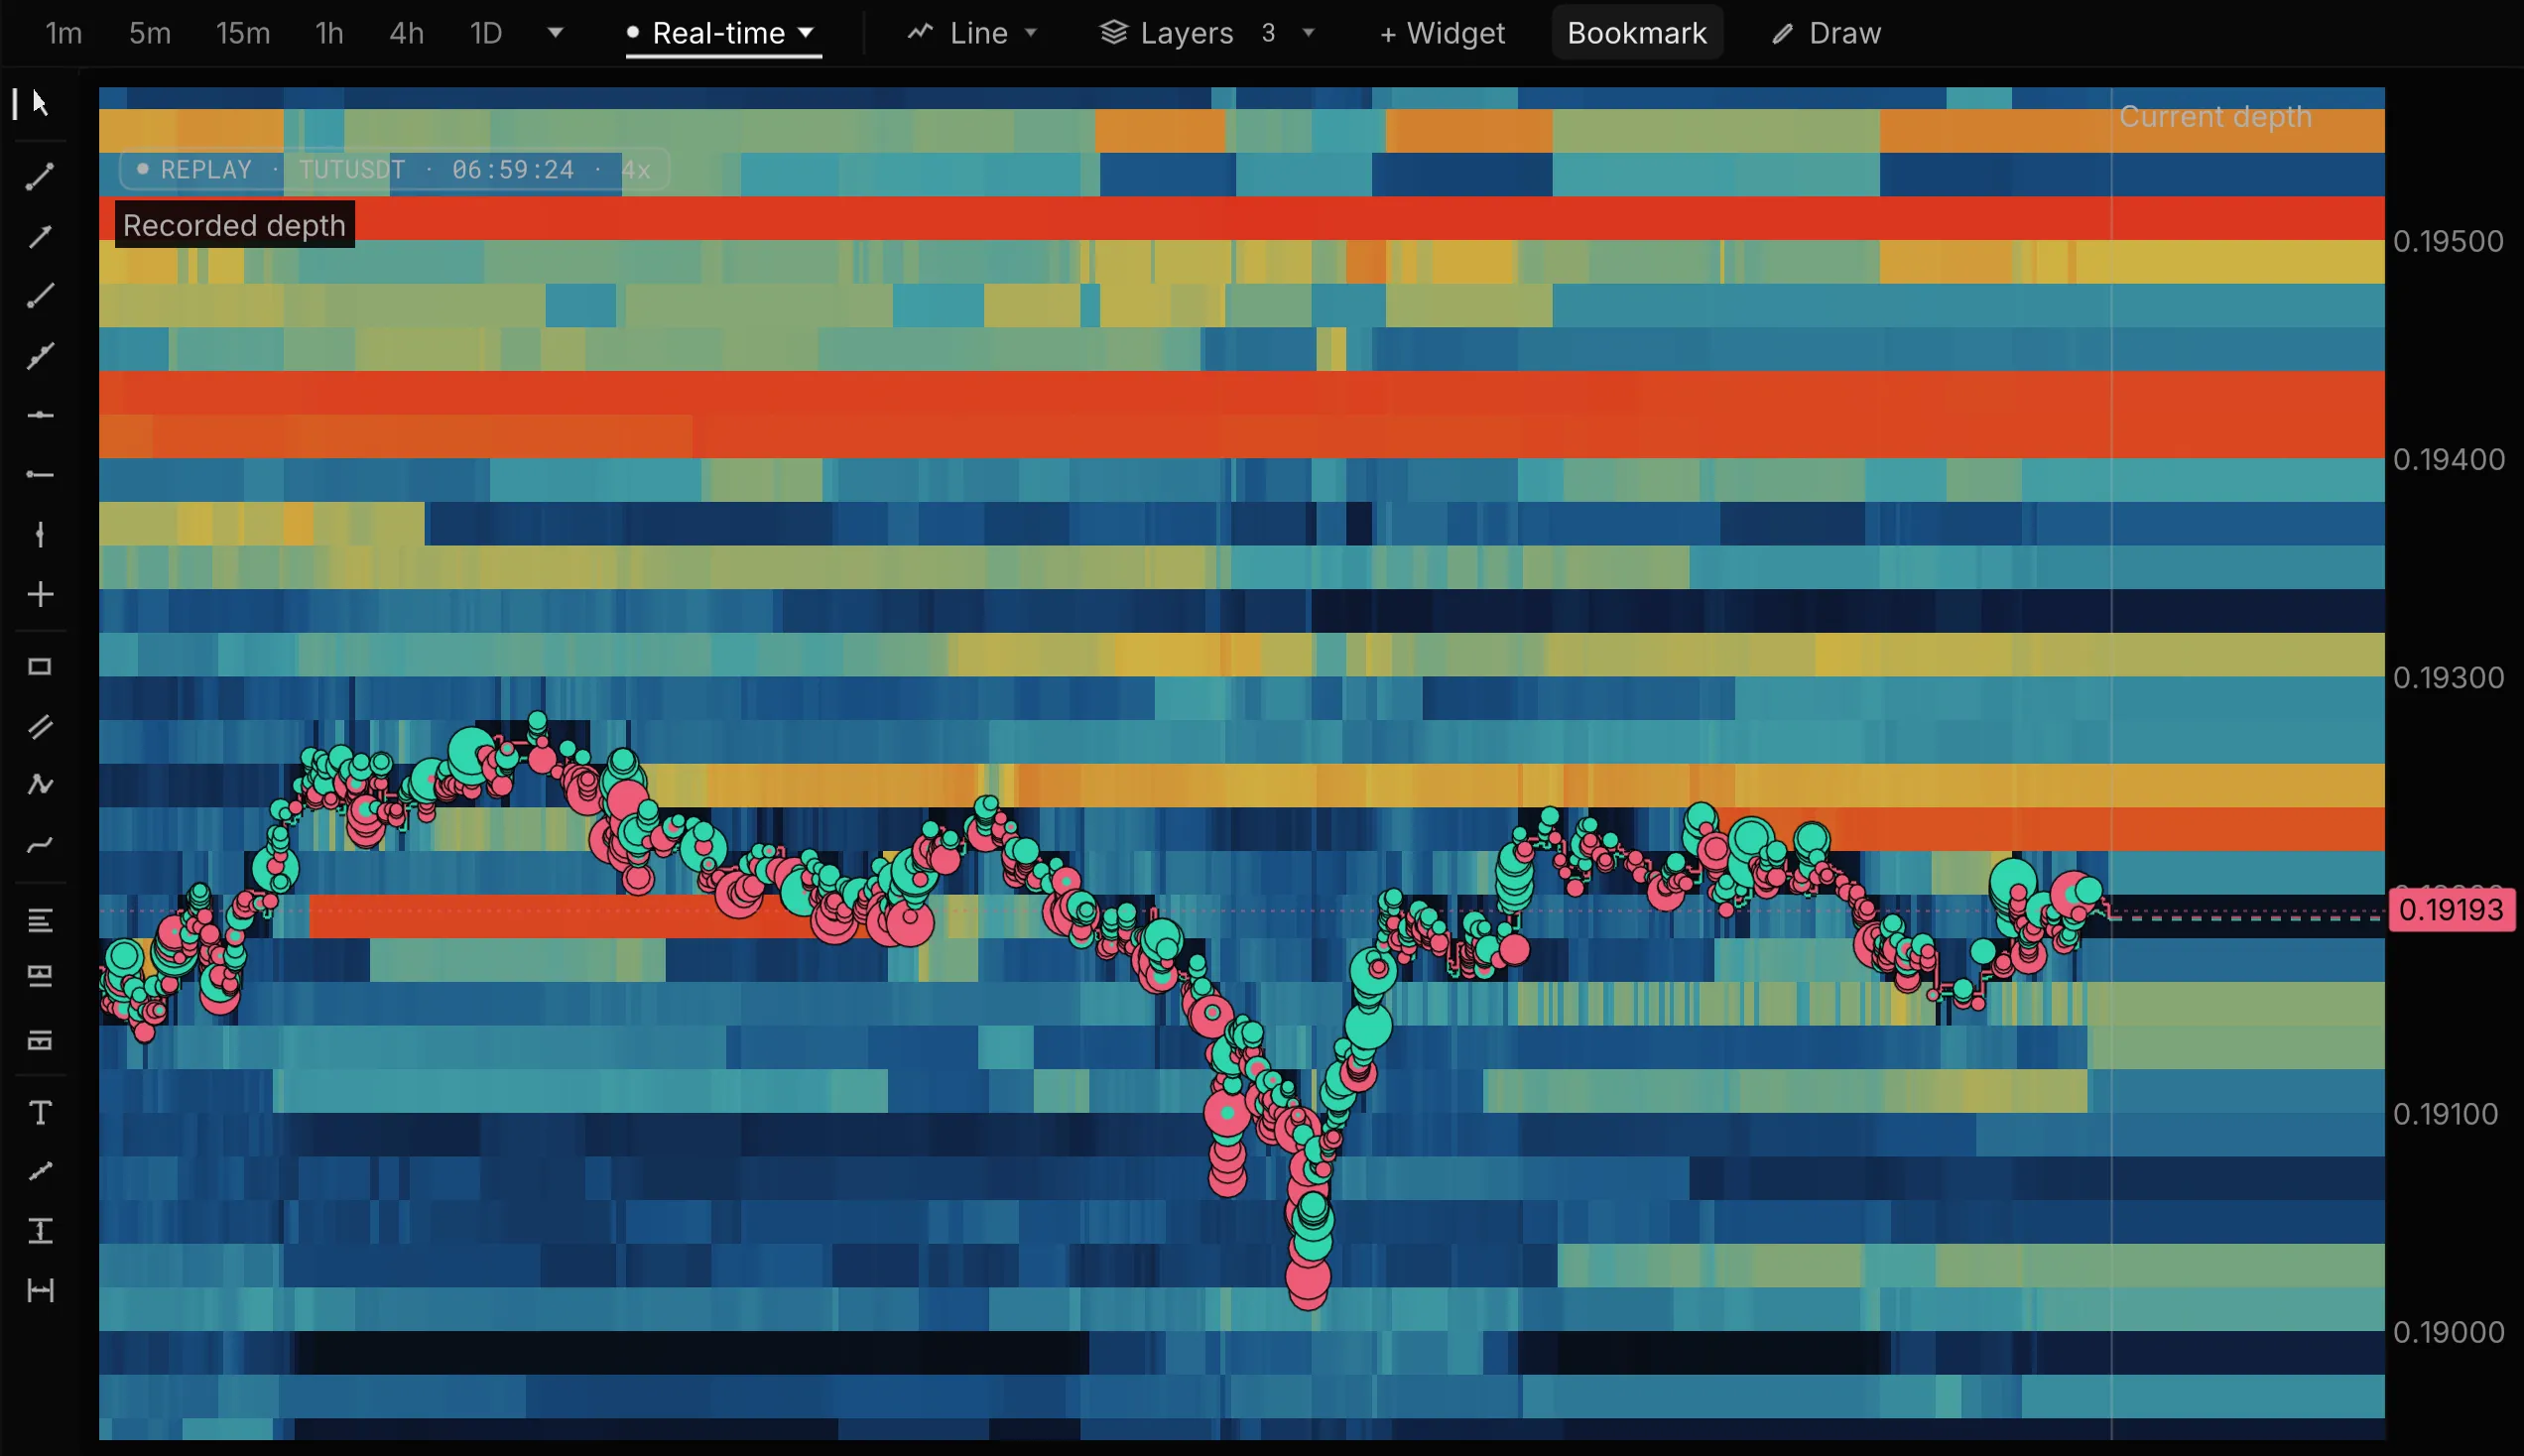
In a replay the order book, every trade and the liquidations play back together on one clock. Pause on the second it turned, rewind, play it at half speed, and switch to Real-time to watch price climb through the resting offers.
Our liquidation maps are checked against what happened, every day, misses included. None of the 11 liquidation map and heatmap tools we surveyed publishes that.
TUT/USDT · Binance Futures · Real-time replay, 9 Aug 2026, 06:59:24 UTC
02Order book and tape
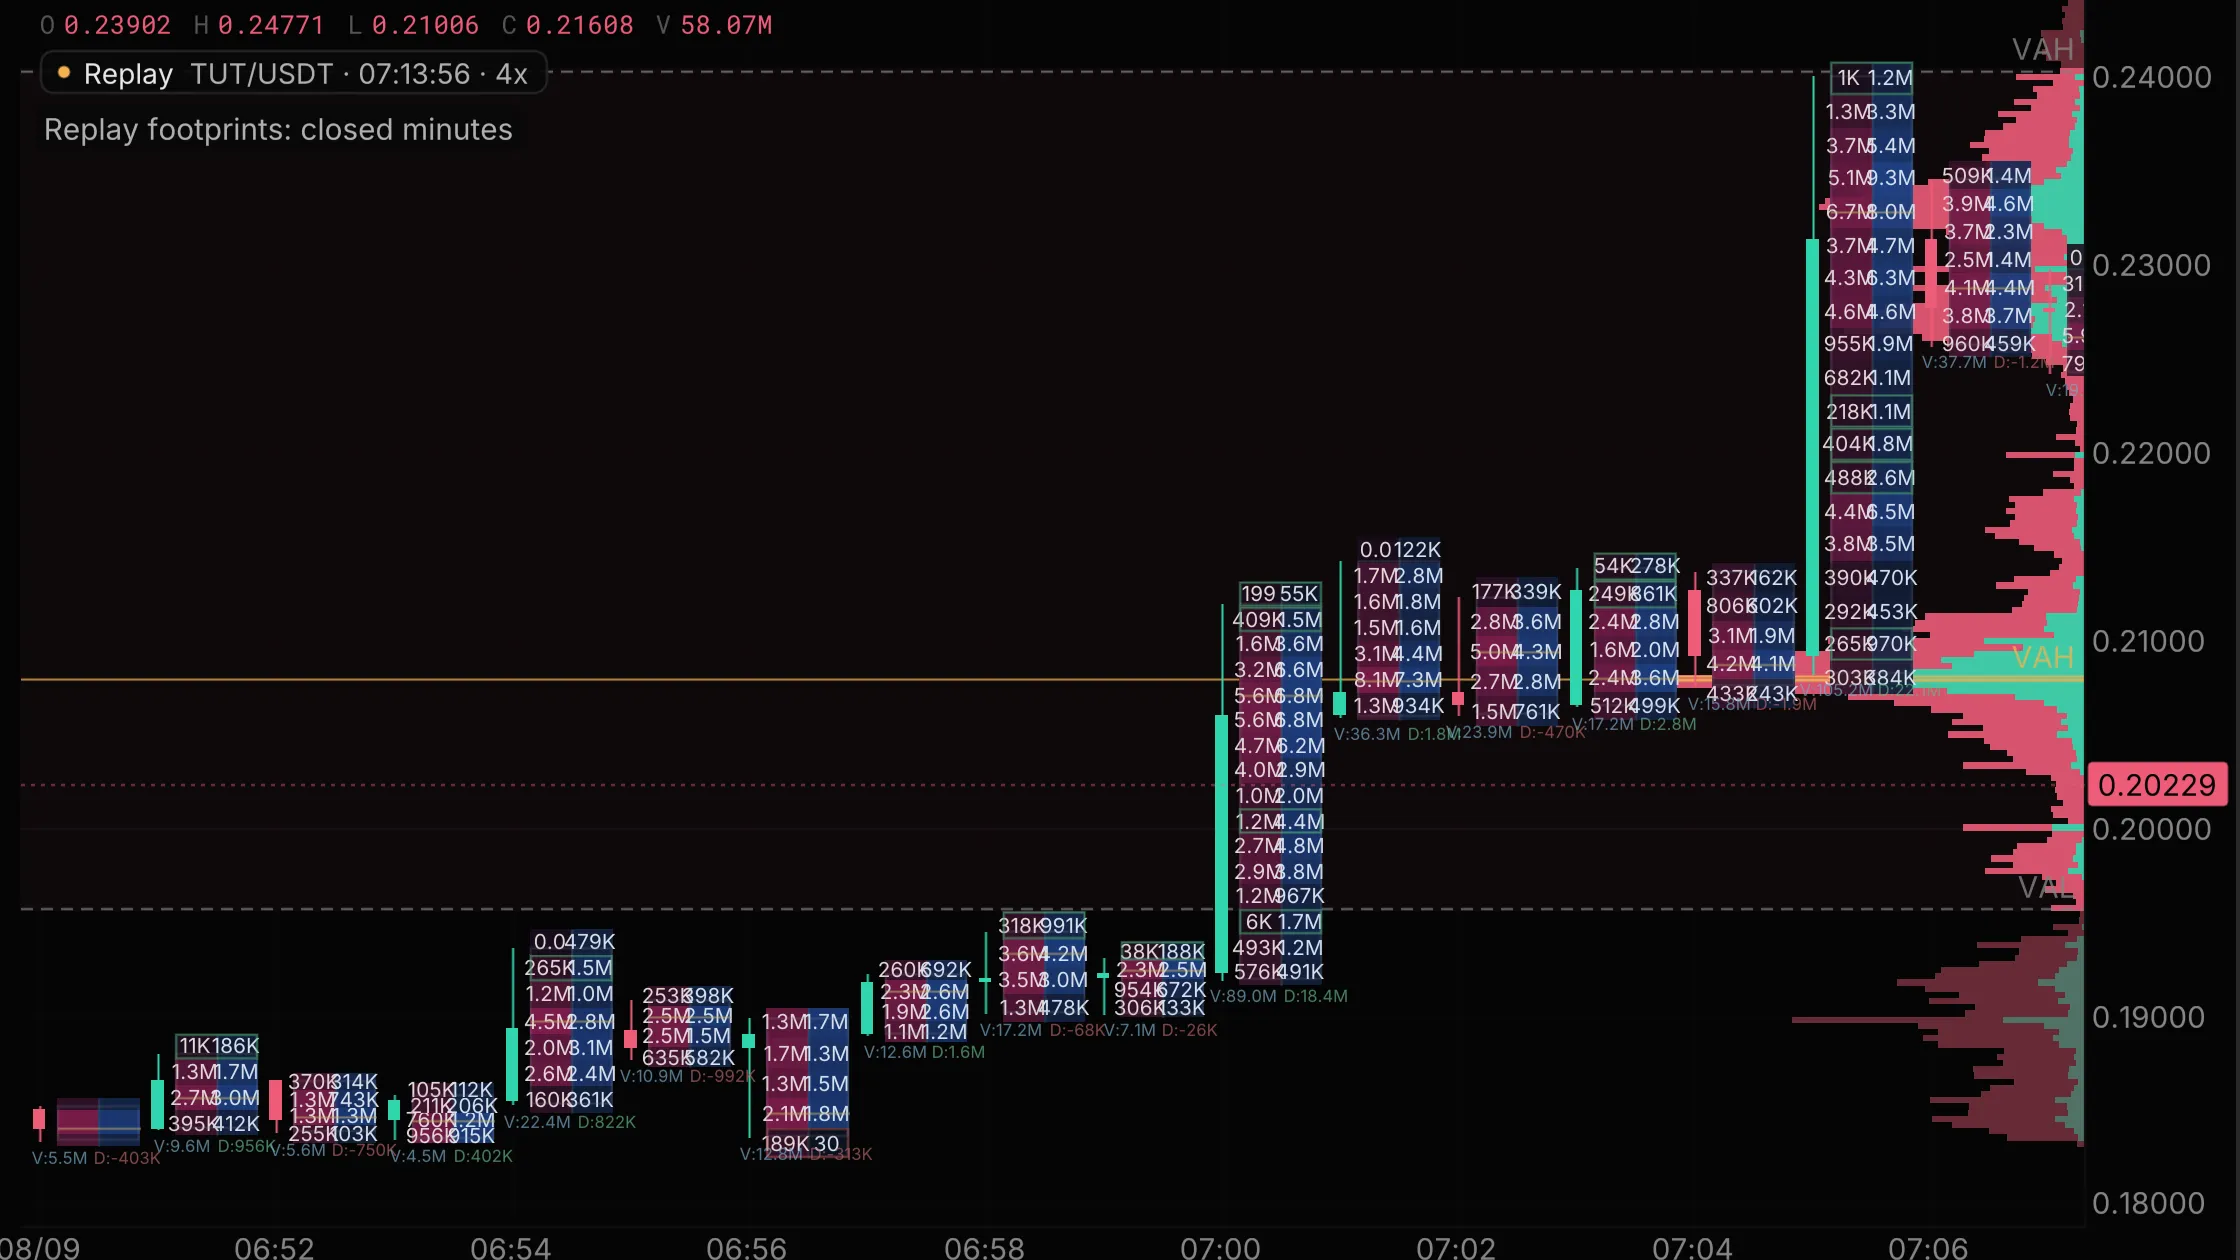
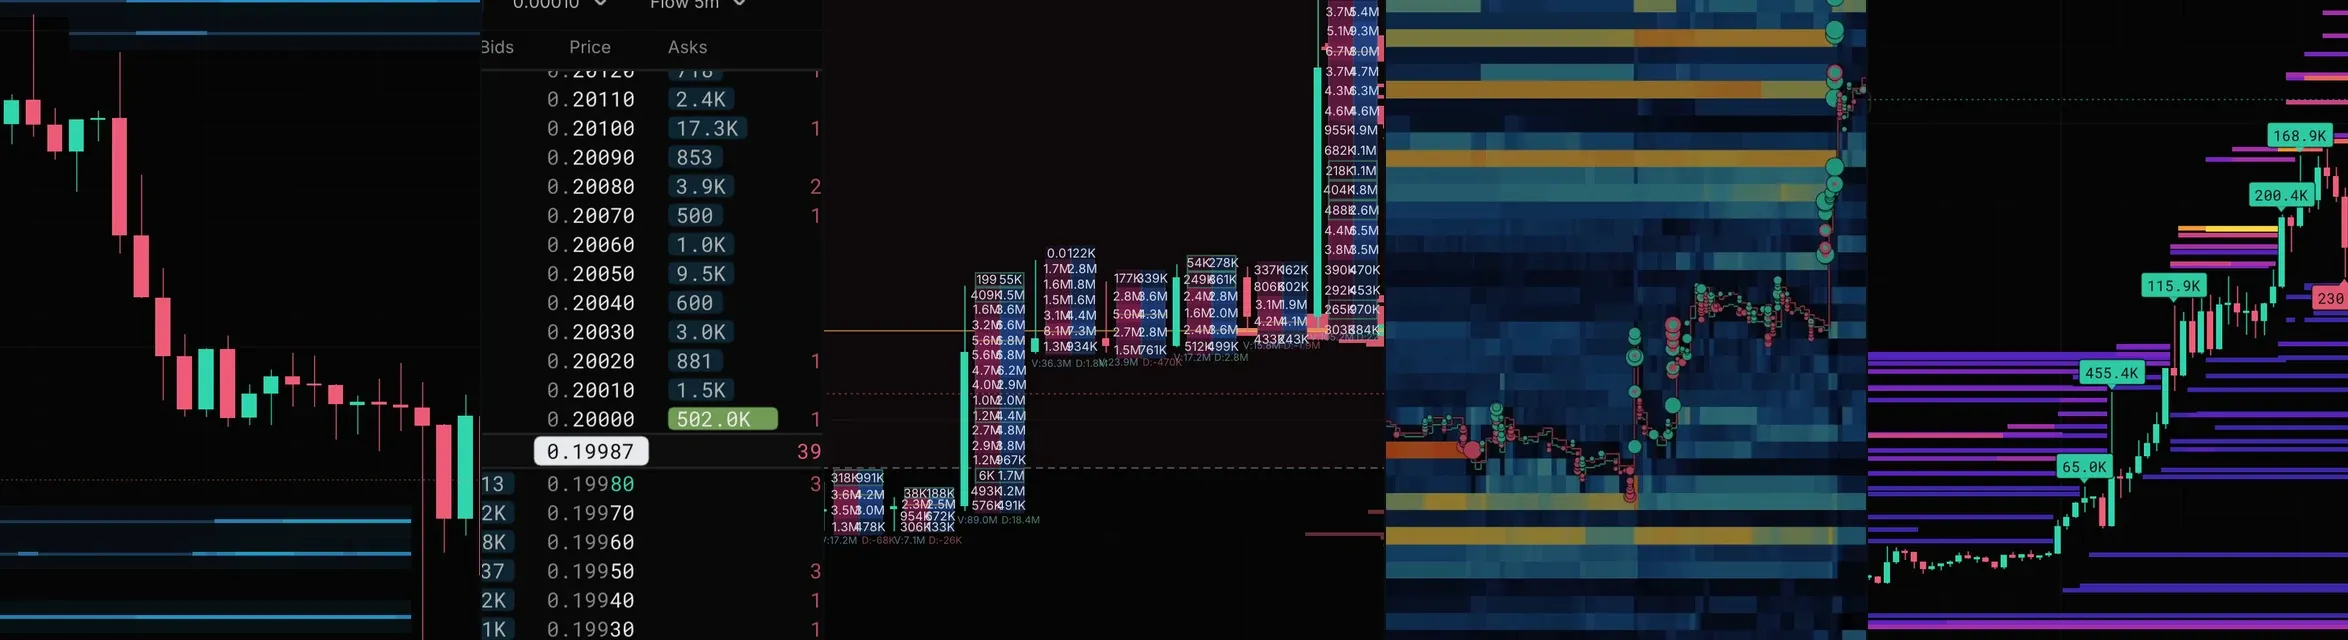
Resting size at every price beside the buys and sells traded there, and the tape with the buy and sell pressure across it: who is aggressing, second by second.
Free accounts replay any archived move from the past 7 days. Reported liquidations need Pro. Archive snapshot 17 Oct 2026, 21:30 UTC
One move, start to finish
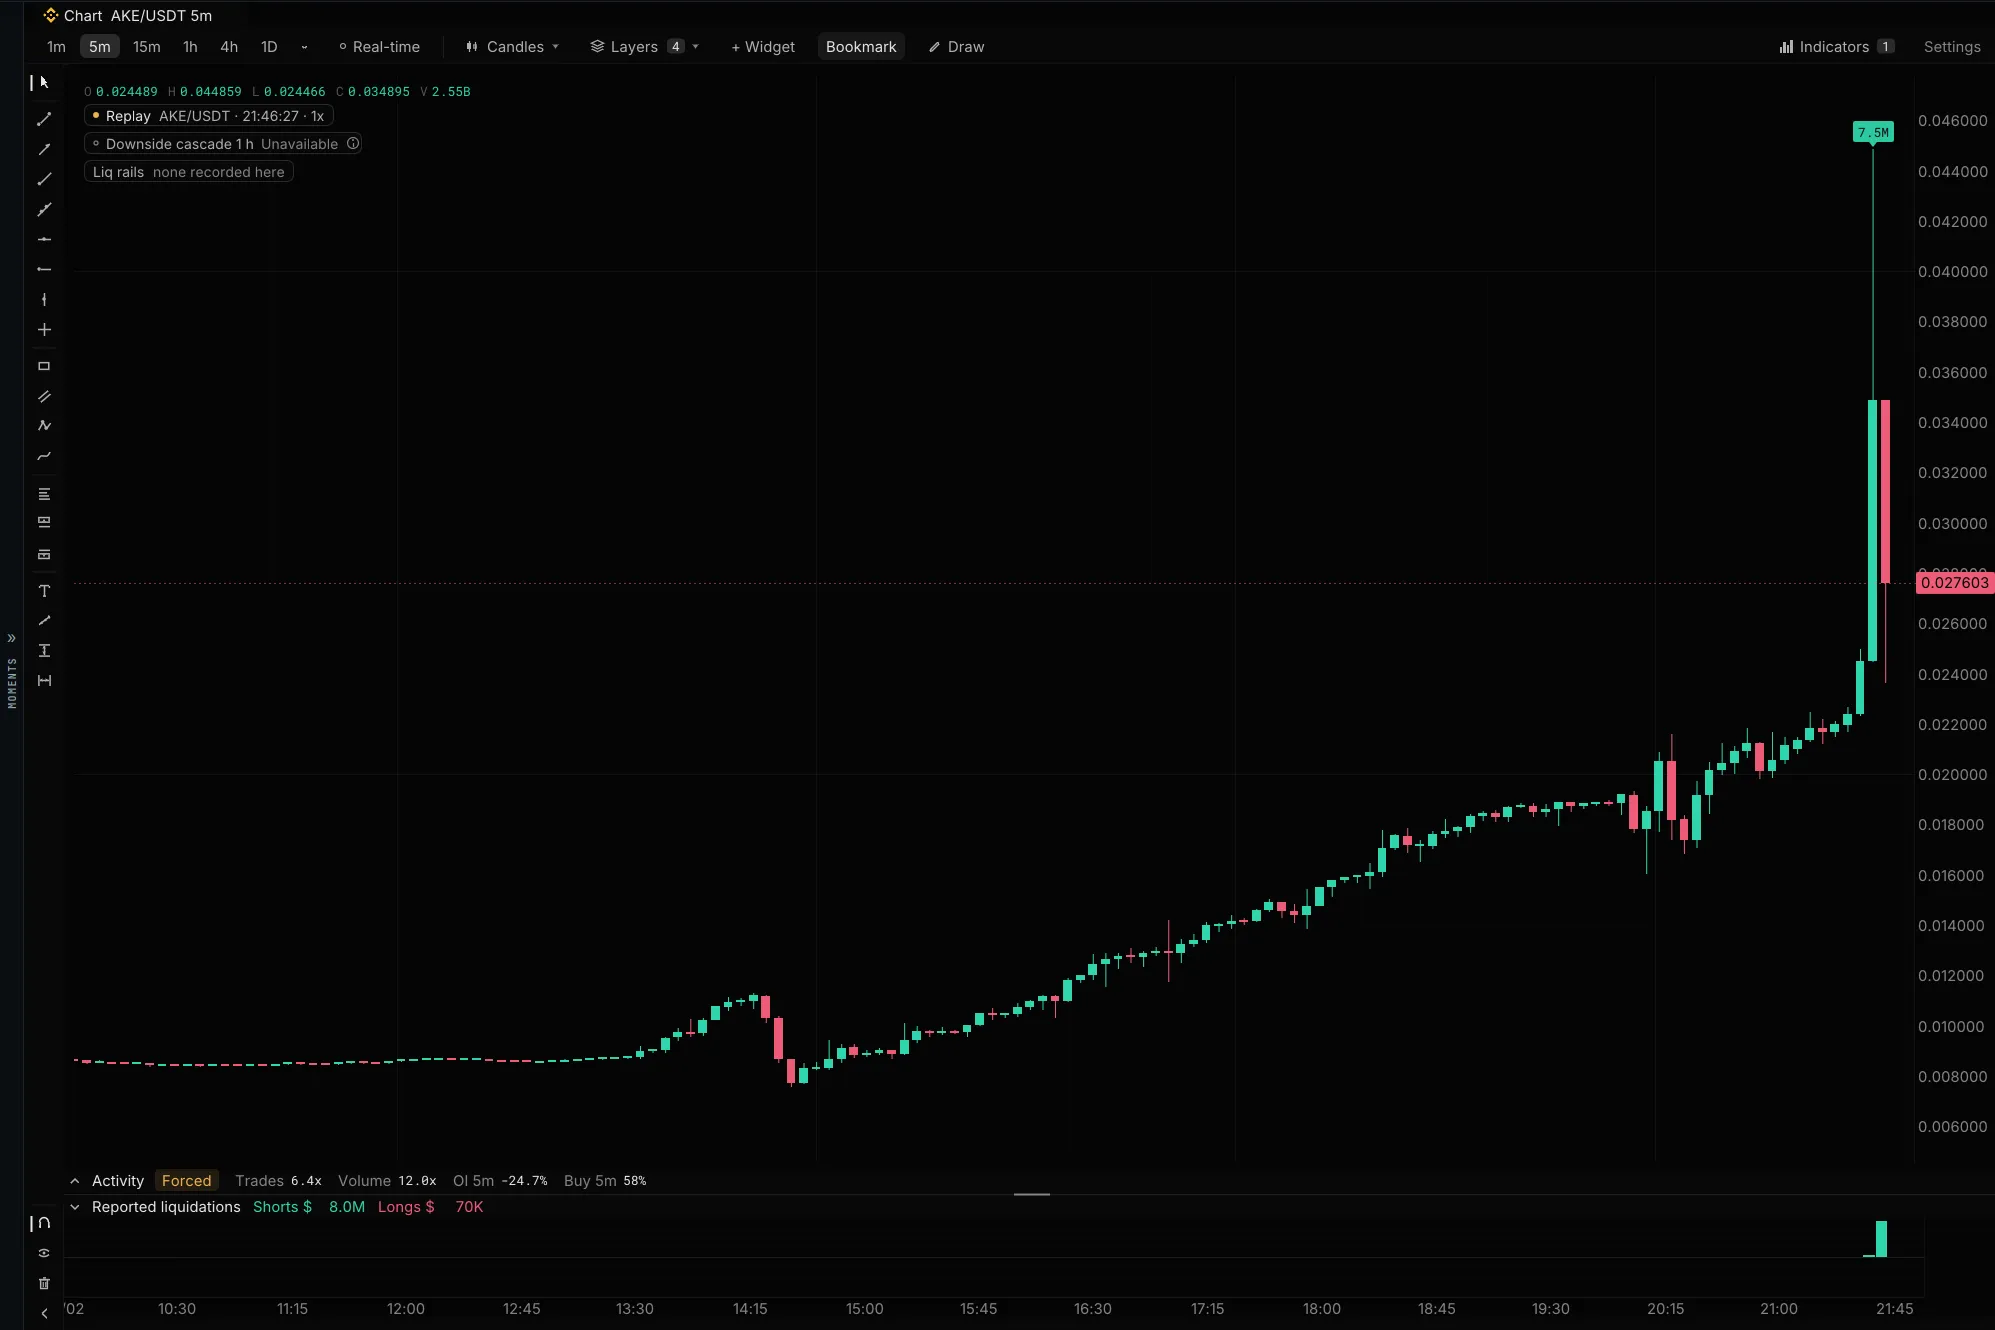
AKE rose 338% in under 8 hours. Every tick is kept.
AKE/USDTBinance Futures perpetual2 Sep 2026
AKE/USDT · Binance Futures 5m · 2 Sep 2026 · to 21:46 UTC · Recorded replay. Shaded: the chapter you are reading.
14:00 to 21:39 UTC · recorded the whole way
The climb
From the 14:00 open at 0.010237, AKE climbed for more than seven hours. Every trade and the recorded book along the way are in the replay, so you can start it from any candle on this chart.
Footprint and TPO are free on every market.
21:43 UTC · in Real-time
Through the book
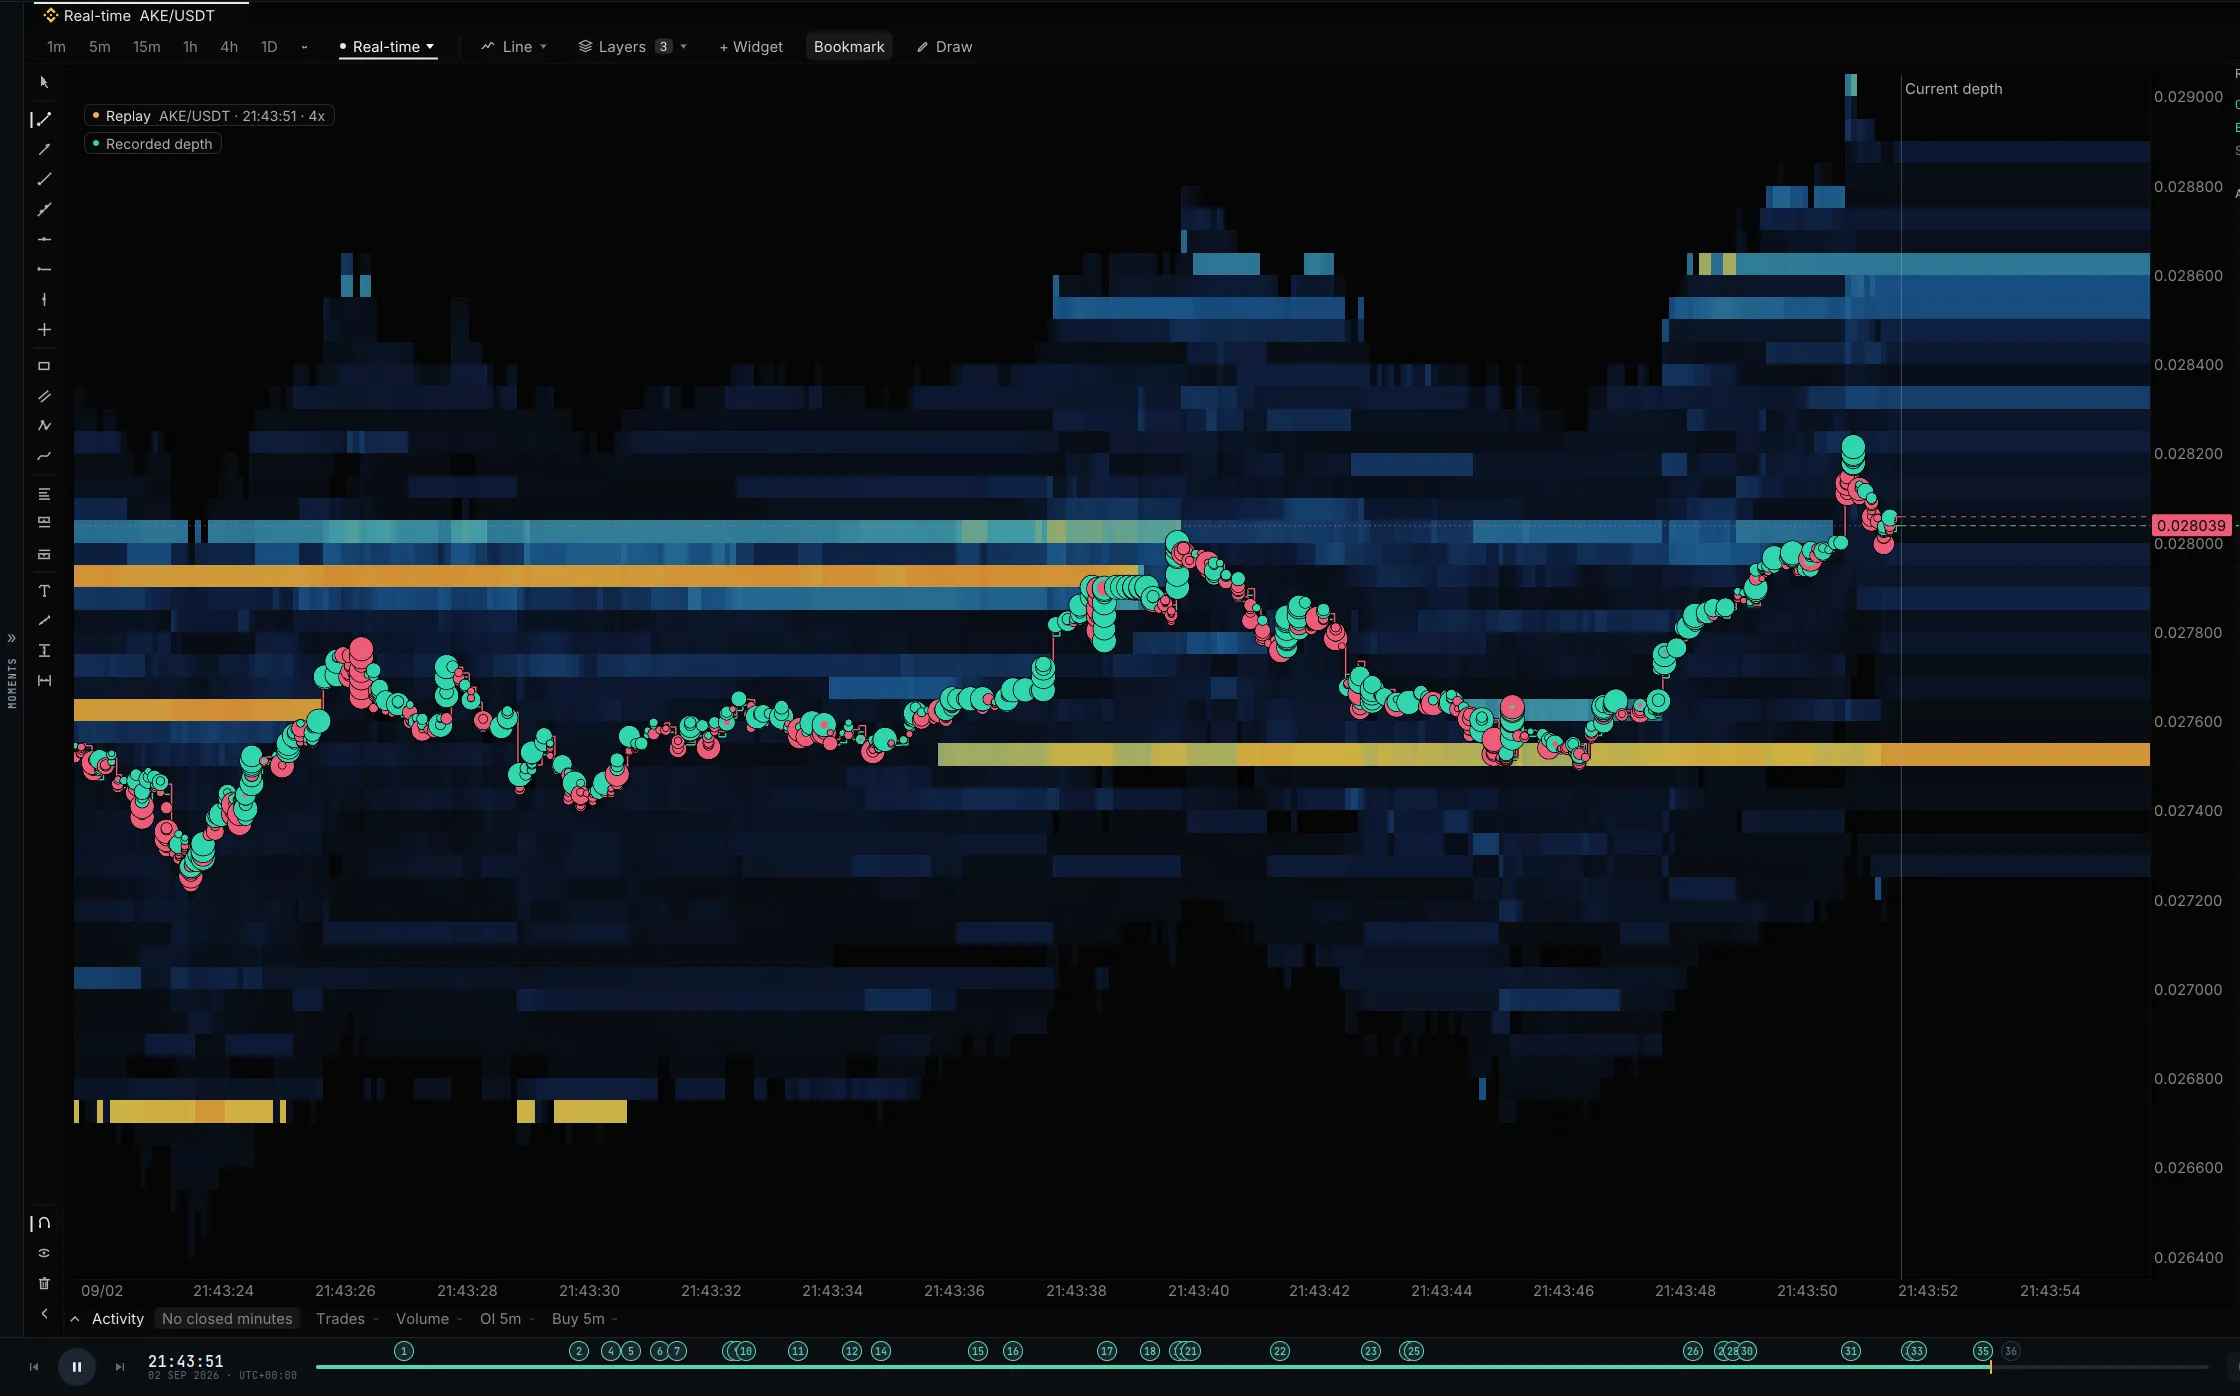
At 21:43:45, under a minute before the squeeze, price dipped into the brightest band of resting bids near 0.0275. It held, and buyers lifted price to about 0.0282 within six seconds.
Real-time is open in every recorded replay.
AKE/USDT · Binance Futures · 2 Sep 2026 · Real-time replay, paused at 21:43:51 UTC
21:44 to 21:46 UTC · +338% at the high
The squeeze
$7.5M
of shorts reported liquidated on the spike candle alone
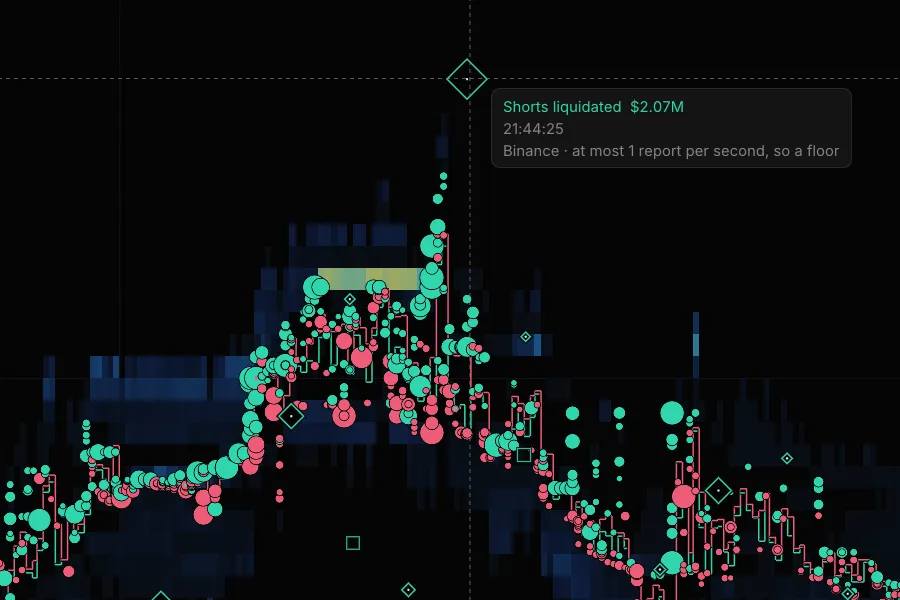
Hover a diamond for the exact report: one at 21:44:25 UTC forced out $2.07M of shorts. $8.0M by 21:46. Reports are throttled, so these are floors.
Reported liquidations are Pro on every market, and included in AKE's replay, free with an account.
AKE/USDT · Binance Futures · 2 Sep 2026 · Real-time replay, 21:44:18 to 21:44:33 UTC, hovering the 21:44:25 report
Every level we draw is checked against what happened.Misses included.
Any tool can draw bright lines. Without a score, you cannot tell a level that matters from one that just looks good. A map that shows its misses is one you can believe when it hits.
9%of the time, price sat at our BTC levelsabout 15 of 172 hours scored
64%of the liquidated dollars came in those minutes$197.76M of $308.58M reported
Price at our levelsEverywhere else
7.2×the average rate of liquidated dollars, while price sat at our levels
If liquidations came evenly, 9% of the time would hold about 9% of them. These levels held 64%.
How it is scored
We checked 11 liquidation map and heatmap tools on 4 October 2026. None published how often its levels met real liquidations.
The harder test is still running: we wrote down the pass and fail rules for our liquidation rails before 13 October, and publish the result on or after 16 November, pass or fail. Read the registered test →
Liquidations bunch up in big moves, which also reach more levels, so the time bar flatters the map. Binance’s reported feed is a lower bound, so dollar figures are a floor.
+Reported liquidations on every market, as each exchange publishes them, on candles and in Real-time
+Hyperliquid liquidation heatmap: real-position rails on every coin, with history
+Live V2 liquidation rails on all supported markets (forward test from 13 Oct)
Research
Work in progress
More capacity for your own investigations.Research is a work in progress. Estimated release: 1 December 2026. Our goal is to make it a search engine for trading setups in recorded crypto markets.
$49/mo$69/mo
$588 billed yearly · save $240Billed monthly · cancel anytime
+300 research credits a month for more questions and follow-up studies
+Tick replay over the last 90 days
+Onboarding call with the founder and a first-study review with written notes
Before you start
+What can I use free?
Charts, footprint, TPO, order book and tape on every market. Live depth on Binance Futures BTCUSDT all day, plus a free 3-minute daily preview on any other market. Replay the past 3 days of BTCUSDT and any archived move from the past 7 days. Pro adds reported liquidations and live depth on every market, all day.
+Which markets does it cover?
Live and recorded: Binance USDT-M, Hyperliquid and Bybit perpetuals. Coverage differs by market, stream and date, so check data coverage for the window you need.
+Does it run in my browser?
Yes. The terminal is C++ compiled to WebAssembly and draws through WebGL2, so it runs in an ordinary browser tab. No install, no download, and the free tier needs no card.
+How far back can I replay?
Free accounts replay the past 3 days of BTCUSDT on Binance Futures at 1x (6 replays a day) and any archived move from the past 7 days. Pro replays a rolling 30 days of Binance history on every supported market, tick by tick. Coverage differs by market and date.
+Can I place live trades here?
No. EdgeDepth is analysis, replay and research. Keep live order execution on your exchange or execution platform. A simulated order in a replay exercise is not a live exchange order.