Footprint charts: the buying and selling inside each candle
A footprint chart shows how much was bought and sold at every price inside each candle. How to read the cells, delta, imbalances and stacks, what a footprint cannot show, and a free footprint chart for crypto perps.
A footprint chart opens up each candle. A candle shows four prices: the open, high, low and close. A footprint shows every price the candle traded at and how much traded there, split into volume that sold into the bid and volume that bought from the ask. Traders also call it a volume footprint, a cluster chart or a bid/ask footprint.
The candle tells you where price went. The footprint tells you where the volume was and which side was pushing.
How to read one candle
Each row is a price, and each row has two numbers:
- Left, sells: volume from traders who sold at the market, hitting the bid.
- Right, buys: volume from traders who bought at the market, lifting the ask.
Every trade has a buyer and a seller, so “more buyers than sellers” is never literally true. What a footprint splits is the aggressor: the side that crossed the spread to be filled at once. On EdgeDepth that side comes from the exchange’s own trade feed, not from a guess based on whether the price ticked up or down. Order flow explains the difference.
Three readings come out of the numbers:
- Volume at each price. Where the candle did most of its trading. The price with the most volume is the point of control (POC).
- Delta. Buys minus sells for the whole candle. A positive delta means more volume came from aggressive buyers. The running total of delta across candles is cumulative volume delta.
- Where in the range the volume sat. A candle that closed near its high with most of its volume at the low tells a different story from one that did its volume at the high.
Imbalances and stacks
An imbalance is a price where one side traded far more than the other. There are two common ways to compare:
- Diagonal. Buys at a price against sells one row below, and sells at a price against buys one row above. Most footprint tools compare this way, because an aggressive buy takes the ask, which sits one tick above the bid that an aggressive sell hits.
- Same price. Buys against sells in the same row.
A ratio decides what counts, and 3:1 is a common default. In the illustration, 95 bought at 101.4 against 28 sold one row below is 3.4:1, a buy imbalance.
A stack is several imbalances on the same side in consecutive rows. Traders read a stack of buy imbalances as aggressive buyers stepping up through several prices, and often watch the stacked prices as a level price may come back to. That is a reading, not a rule: how often price respects a stack is a question for the record, not for a chart.
What a footprint cannot show
- Who traded, or why. One large order and fifty small ones can print the same number.
- Resting orders. A footprint counts trades that happened. Orders waiting in the book appear in the DOM, and orders pulled before they traded never appear in a footprint at all.
- Absorption on its own. Heavy selling at a price that does not fall shows up as volume without movement. Telling absorption apart from a pause needs the book and the candles that follow.
Footprint charts in EdgeDepth
Footprints are free on every market in EdgeDepth, across Binance USDT-M, Hyperliquid and Bybit perpetuals: live, and in replays of recorded moves.
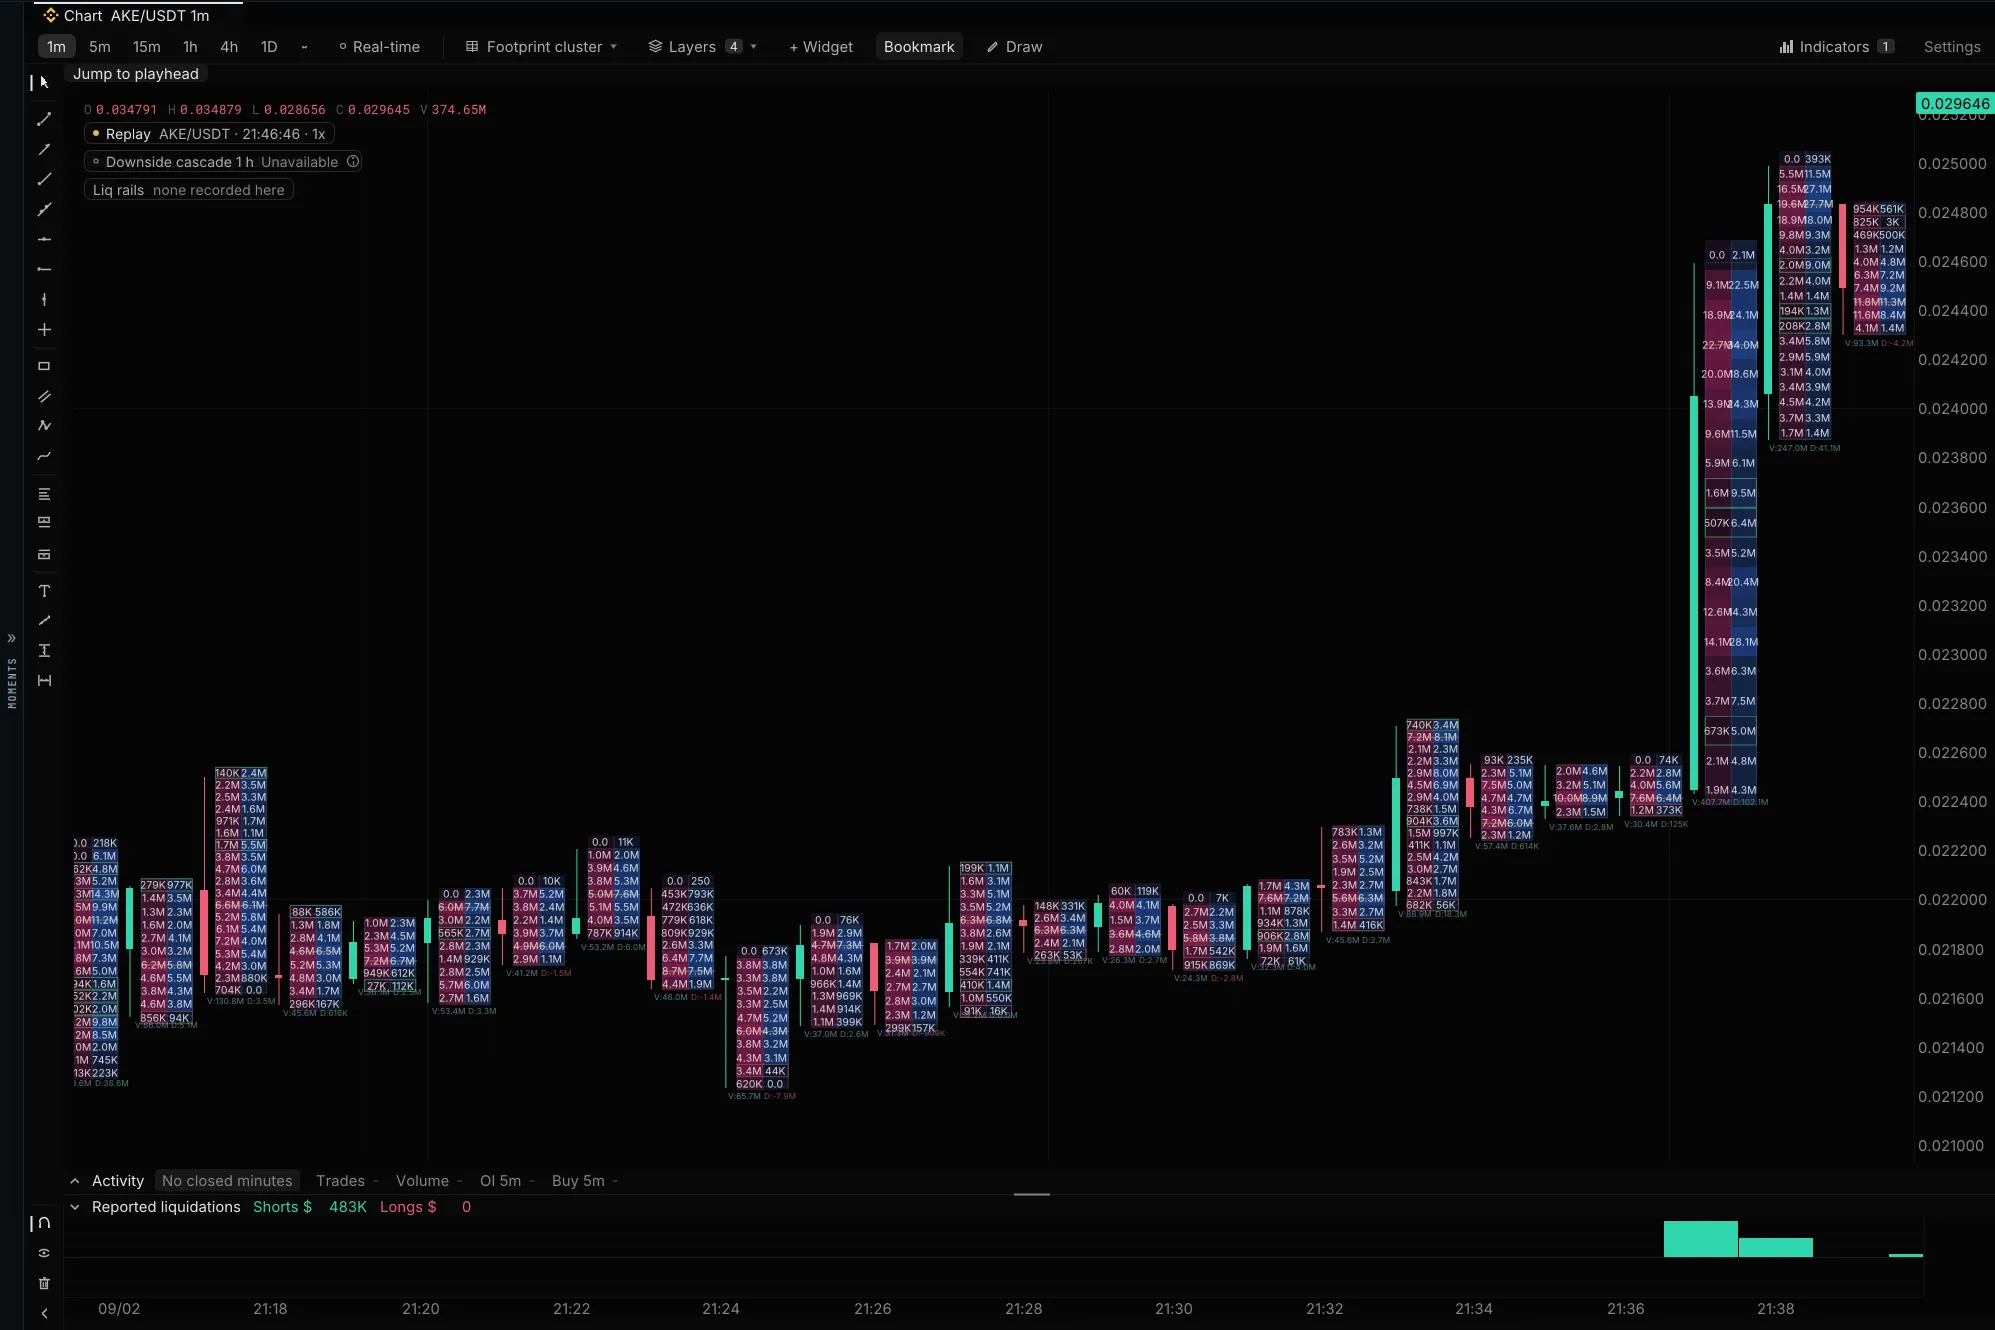
- Turn it on. Open the chart views menu and pick Footprint cluster (bid and ask volume at every price) or Footprint profile (the shape of traded volume inside each bar). Footprints need one-minute candles or longer.
- Modes. Cluster, Delta, Volume and Profile, in the footprint settings.
- Imbalances. Choose a diagonal or same-price comparison, a ratio from 1.5:1 to 10:1 (3:1 by default) and a minimum volume. Thin outlines mark imbalances. Thick outlines mark stacks of 2 to 10 consecutive levels, which are off until you set a number. Sells are on the left, buys on the right.
- Display. A POC marker, and a volume and delta footer under each candle.
- Live and replay data. A live footprint builds from the trades the terminal has received, so a candle can be partial if you joined or reconnected during it; the closed one-minute snapshot then replaces it. A replay uses closed minutes at the replay clock and never fills in volume that is missing or still in the future.
The open-source terminal has footprints with imbalances too, for recordings you run yourself.
To try it with no sign-up, open the public replay and switch the chart to Footprint cluster.
Footprint chart questions
Is there a free footprint chart for crypto?
Yes. EdgeDepth’s footprint is free on every market it covers, live and in replay, on the Free plan. Free also includes charts, TPO, the order book and the tape; Pro adds reported liquidations and live depth on every market, all day.
Footprint chart or volume profile?
A volume profile adds up volume by price over a whole session or range and shows it as one histogram. A footprint does the same inside each candle and splits buys from sells. EdgeDepth’s TPO market profile shows a related picture: how long price spent at each level.
Footprint chart or order book heatmap?
A footprint counts trades that happened. An order book heatmap draws resting orders over time, including orders that were pulled before anything traded. They answer different questions. In EdgeDepth, the Real-time view draws the order book behind every trade, and the DOM sits beside the chart.
What timeframe works best?
A footprint needs enough trades at each price to say something. Very short candles leave most rows nearly empty, and long candles merge everything into a few busy rows. Many traders use one to fifteen minutes on liquid perpetuals. EdgeDepth draws footprints on one-minute candles and longer.
Looking for a calculation? Open the Reading library. For recorded exercises, browse guided lessons.