Crypto market microstructure, explained
How order books, trades, spreads and liquidity shape crypto prices. Read a real replay, understand the limits and turn observations into testable questions.
Crypto market microstructure is how trading actually happens: how orders meet, liquidity changes and trades form prices. It helps explain why the same amount of buying can move one market sharply and barely move another.
A candle summarises a period. Microstructure lets you inspect the orders, quotes and trades inside it. This guide focuses on order-book markets, including crypto perpetuals. Automated market maker pools use a different liquidity mechanism.
By EdgeDepth, drawing on our recorded market data and published research.
Read the book · See a recorded example · Test an idea
The readings that matter
- Order book: resting bids to buy and asks to sell. Displayed orders can change or cancel.
- Bid-ask spread: the gap between the best bid and ask. A tight spread can still hide thin depth.
- Depth and liquidity: available size at different prices, and how readily it replenishes. Measure near the price and for the order size you care about.
- Order flow: executed buying and selling through time. Check aggressor side, size and the chosen window.
- Price impact: how prices respond as orders trade and liquidity changes. Separate the immediate move from what persists.
A marketable buy takes resting asks; a marketable sell takes resting bids. Every execution has both a buyer and a seller. “Buy volume” usually describes which side initiated the trade, not an excess number of buyers.
Volume is activity already traded. Depth is size currently displayed. Neither substitutes for the other. A busy market can become difficult to trade when quotes withdraw. CME’s liquidity methodology measures spread, depth and cost to trade separately for this reason.
Why combinations matter
Imagine aggressive buying meeting a large resting offer. If the offer keeps replenishing, substantial buying may produce little price movement. If offers withdraw instead, less buying may move price further. These are illustrative mechanisms, not trading rules.
That is why a green trade bubble or a bid-heavy book is a starting observation. Ask what price did, how the opposite side responded and whether the behaviour lasted. The combination and sequence matter.
Be precise about imbalance. Trade-flow imbalance compares executed buying and selling; other order-flow measures also count book updates. Book imbalance compares displayed bid and ask quantities. EdgeDepth’s Research book-imbalance reading uses the best bid and ask, not the entire visible ladder. Several readings can reflect the same underlying activity; they are not independent votes.
What is different about crypto perpetuals?
Crypto trades across separate venues, each with its own book, fees and participants. A reading from one exchange does not describe the whole market.
Perpetuals add three useful pieces of context:
- Open interest: outstanding contracts. It describes positioning, not whether buyers or sellers will win.
- Funding: periodic payments between longs and shorts. The rate and settlement schedule matter; extreme funding does not establish a reversal.
- Liquidations: forced position closures. Exchange reports can be incomplete, so received liquidation notional is not necessarily the total.
This context complements the book and tape. It does not replace them.
Read a real order-flow recording
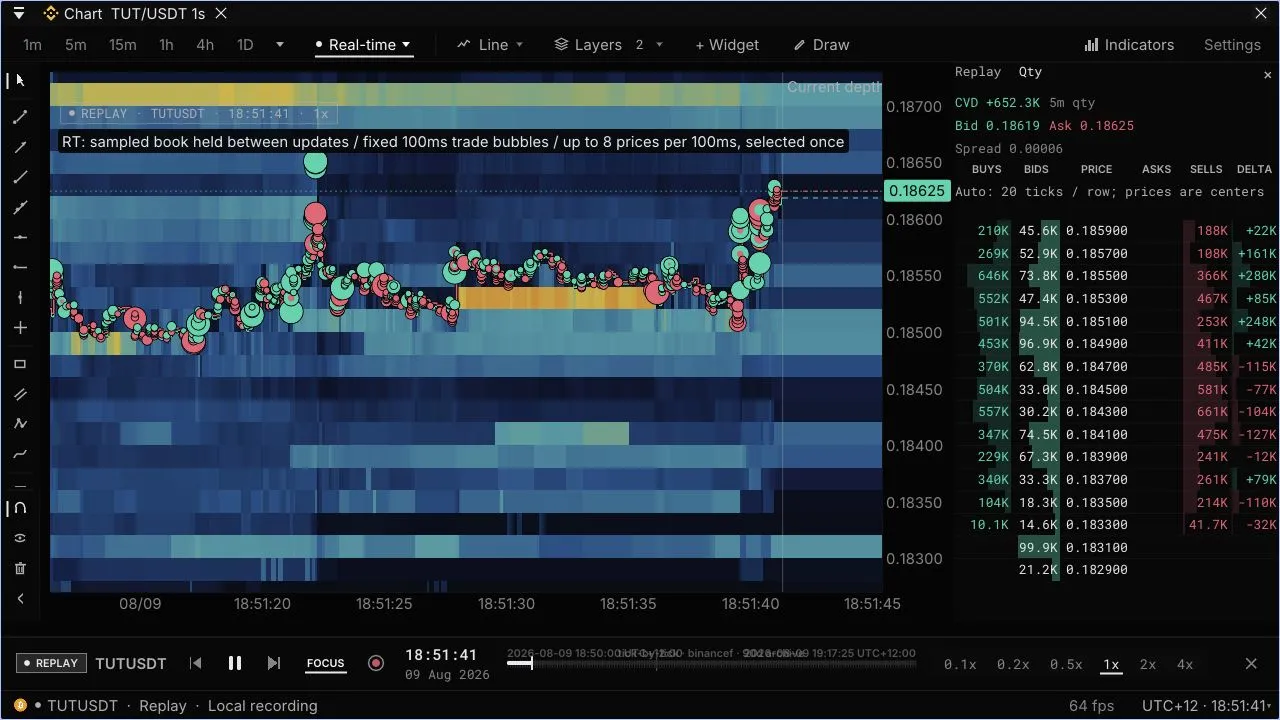
TUT/USDT, Binance Futures, recorded 9 August 2026. Actual OSS terminal capture from 1 October 2026; the displayed clock uses UTC+12. Depth is sampled and dense trade history can be grouped. This replay is separate from the published study below.
Watch the 20-second replay clip or open the public recorded replay.
Read it in this order:
- Book: the horizontal bands show sampled resting liquidity. Brighter bands represent larger displayed size under the chosen colour scale.
- Trades: the circles show received executions. Compare their location with the nearby liquidity and price path.
- Response: pause and step through the sequence. Does displayed size trade, disappear or replenish as price approaches?
A screenshot cannot tell you whether a disappearing order traded or was cancelled. Even a recording has sampling and coverage limits. Inspect the book alongside the tape before giving the pattern a name. The real-time order-flow guide explains the display controls.
Turn an observation into a test
A repeatable process is more useful than a collection of convincing screenshots:
- Define the condition. Name the venue, markets, readings, units and lookback. If combining conditions, specify whether they coincide or happen in sequence.
- Choose the outcome first. A closing return, an intraperiod high and reaching a target before a stop answer different questions.
- Count eligible cases and compare. Include missing observations, contradictory examples and a relevant baseline. Repeated minutes and correlated markets are not independent evidence.
- Challenge it on later data. Keep the definition fixed, check concentration by market and day, and account for how many variants you tried. Fees, spread, slippage and funding separate price behaviour from trading returns.
A published example that challenges a familiar belief
Does extreme negative funding mean a bottom is near? This is a positioning example of the same testing discipline, not an order-book study.
| Study definition | Scope |
|---|---|
| Condition | Funding at or below −1%, with at most 30 minutes until settlement. |
| Outcome | Closing return 24 hours after each matched episode. |
| Recorded population | 677 Binance USD-M perpetual markets, 15 May to 26 July 2026 UTC; 105 episodes. Original combined market scope, not a result for each market. |
82 of 103 complete episodes closed at least 2% lower; 17 closed at least 2% higher. Two episodes lacked complete outcomes. No same-scope baseline is pinned to this report, so these counts do not establish lift or a profitable strategy.
Inspect the pinned report and its market list, including examples in both directions. The full write-up explains the narrow definition and its limitations. These historical counts describe that sample; they do not forecast the next event.
Start your own investigation
Use the research workflow to move from a market observation to an explicit question. The reading library defines the supported calculations; coverage tells you which dates and streams exist.
For capture specifications, venues and access, see EdgeDepth’s crypto market microstructure data. Order-book history requires snapshots, ordered updates and continuity checks; Binance’s reconstruction instructions show why collecting it reliably is a separate job from drawing a chart.
Looking for a calculation? Open the Reading library. For recorded exercises, browse guided lessons.