The terminal at a glance
How the live Binance and Hyperliquid terminal reads: watchlist, ultra-high-definition depth heatmap, real-time chart, DOM, large-trade tape, stats strip and status bar.
The default layout puts everything on one eye-line: what’s moving (left), what price is doing and where the pressure sits (center), and who is doing it (right), with positioning context above and telemetry below.
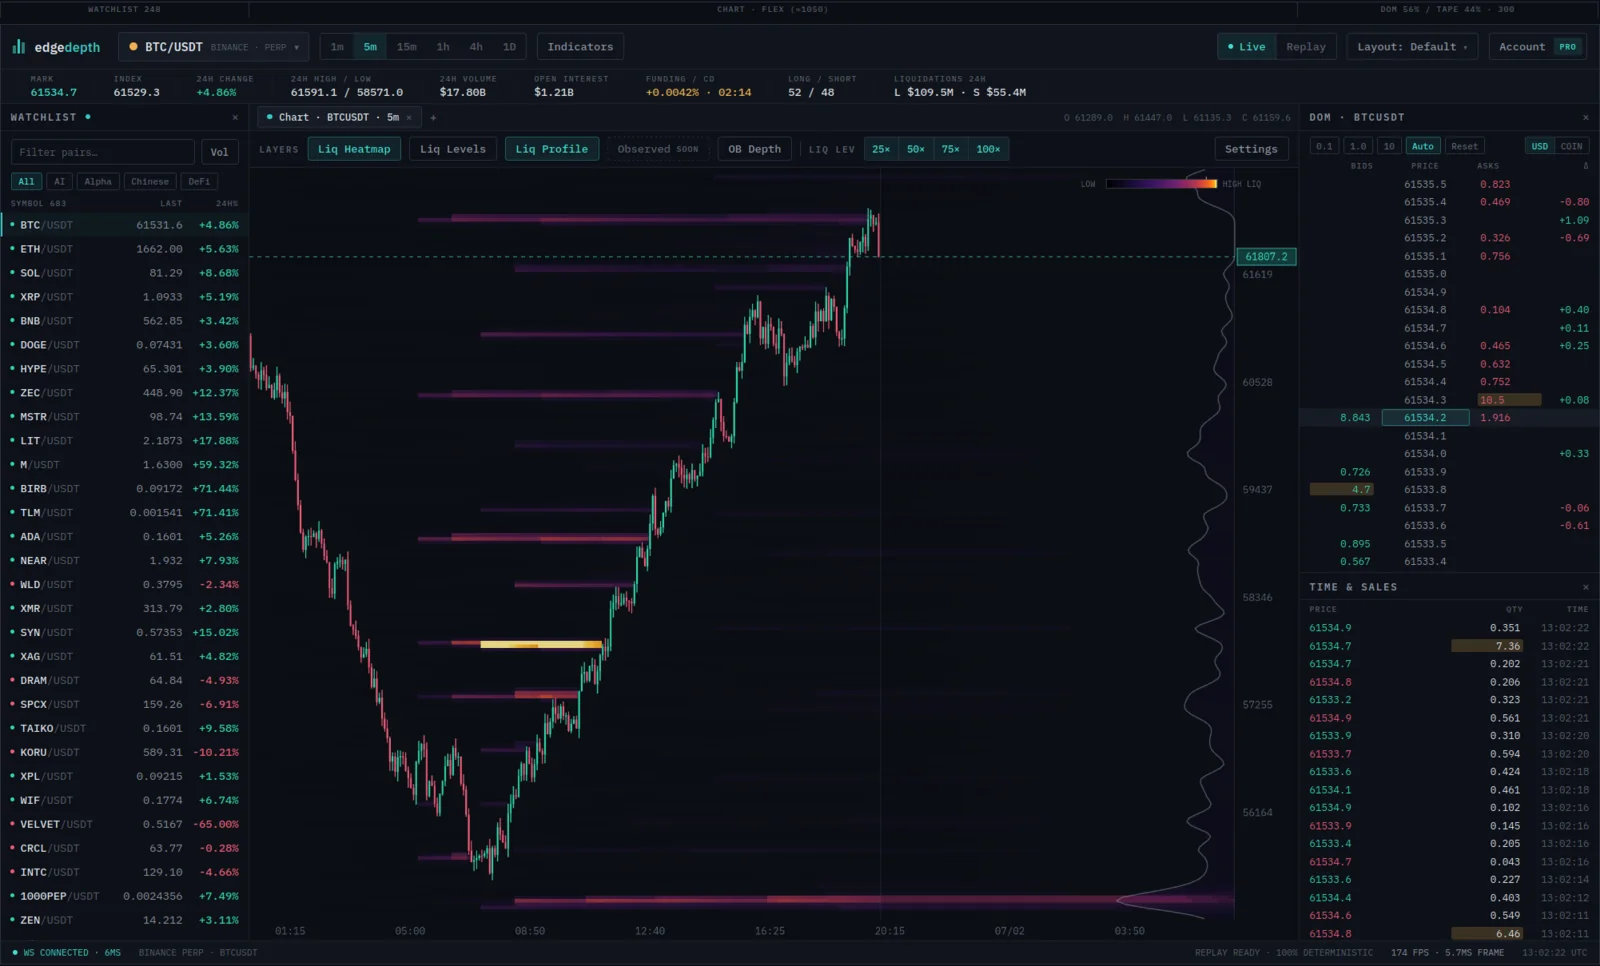
Watchlist (left)
670 Binance USDT-M crypto perpetuals, plus eligible Hyperliquid crypto perpetuals with last price and 24h change: crypto majors, long-tail alts and confirmed crypto indices. Stocks, traditional indices, FX, commodities and gold-backed tokens have been retired. Historical reports retain their original scopes and results. Filter by venue, name or preset groups. Replayable history is currently Binance-scoped; Hyperliquid historical data has been backfilled. Historical research and replay are not yet publicly available; derived data and coverage still require validation.
Chart (center)
Timeframes from 1m to 1D, with a Real-time pill beside them. Real-time mode replaces candles with the observed order book and every trade drawn as a bubble; on hosted live markets it is a Pro view, and recorded replays open it for everyone. See trade bubbles for where each kind lives.
The chart is where the terminal’s layers live, each a per-chart toggle in the LAYERS menu:
- Liq Heatmap · Liq Levels · Liq Profile - the three faces of the liquidation map: the dense field behind price, the high-confidence lines on top, and the collapsed distribution down the right edge. Leverage-tier toggles (25× to 100×) filter the field by how far from price positions break.
- OB Depth - an ultra-high-definition history of resting order-book liquidity drawn on the price axis, so you can see the book’s shape against the chart, not just in the ladder.
- Live BBO - native-rate per-symbol Binance bookTicker plus sub-second per-coin Hyperliquid BBO preserves every received best-bid and best-ask price and quantity change, preserved per symbol, keeping the top of book symbol-specific instead of reducing it to occasional summary ticks.
- Trade bubbles (large prints) - trades well above the market’s typical size drawn as bubbles on the candles, coloured by aggressor side and sized by value. Free on every plan; on by default. Every trade, not only the large ones, is the real-time view above.
- Observed liquidations - reported forced orders as diamonds on the chart (Pro).
- Indicators - volume and the standard set, deliberately short. The terminal’s edge is microstructure, not another oscillator.
Right-clicking the chart is also how you enter replay: the menu shows the timestamp under your cursor.
DOM + tape (right)
The ladder and time & sales stack as a single order-flow column, so price axis, resting book and executed prints line up on one vertical. The BBO is driven by native per-symbol Binance bookTicker or sub-second per-coin Hyperliquid updates, and large trades are highlighted by notional. This column is the microscope: the chart tells you that price moved, the column tells you how. It gets its own doc.
Stats strip (top)
Mark, index, 24h change and volume, then the positioning block: open interest, funding with countdown, long/short ratio, 24h liquidation totals. Glance only, never interactive - it answers “what is the state of this pair” in under a second. The positioning numbers get their own doc.
Status bar (bottom)
Telemetry, not decoration: WebSocket state and measured feed latency, render FPS and frame time, clock. If it says WS CONNECTED · 6MS, that is the real number, measured now. A terminal that shows you its own latency is a terminal you can trust when it matters - and when you’re in replay, the amber REPLAY badge and the transport bar are the only things that change.
Performance
Everything renders at about 180 FPS under the measured reference setup, with a 5.7MS FRAME budget. That’s not vanity - a ladder that lags or a tape that batches prints is quietly editing the market before you see it. The engine is C++ compiled to WebAssembly, drawing through WebGL2; the browser tab is doing the same work a desktop terminal would.
From the terminal to Research
The terminal answers “what is happening here?” Research answers “how often has this happened across the record, and what followed all of those matches?” Open Research from a market minute or a replay playhead to read the 87-feature snapshot as of that exact bucket. Confirm or edit the proposed conditions, run the occurrence scan, then return to any matching row in tick replay. The terminal and the search engine are two views of the same capture, not separate datasets.
Looking for a calculation? Open the Reading library. For recorded exercises, browse guided lessons.