The sweep-and-reclaim reversal is a coin flip
The textbook reversal: price pushes below a prior low, triggers stops, then closes back above it. Every course circles it. We measured every hourly occurrence in the record and asked the only question that matters: how often does it actually work?
- 24h forward, of 35,973 with a computable horizon
- 28% rose 2%+ · 29% fell 2%+
- Bigger moves
- 12% rose 5%+ · 10% fell 5%+
- Drawdown first, of 37,959 with a computable horizon
- 25% drew down 5%+ · 6% drew down 10%+
Across tens of thousands of occurrences the next day is very nearly symmetric: about as many rose 2% as fell 2%. The pattern by itself is not an advantage. This is the whole thesis: one beautiful chart is one draw from a distribution that is close to 50/50.
Watch it happen, call it, then meet the denominator.
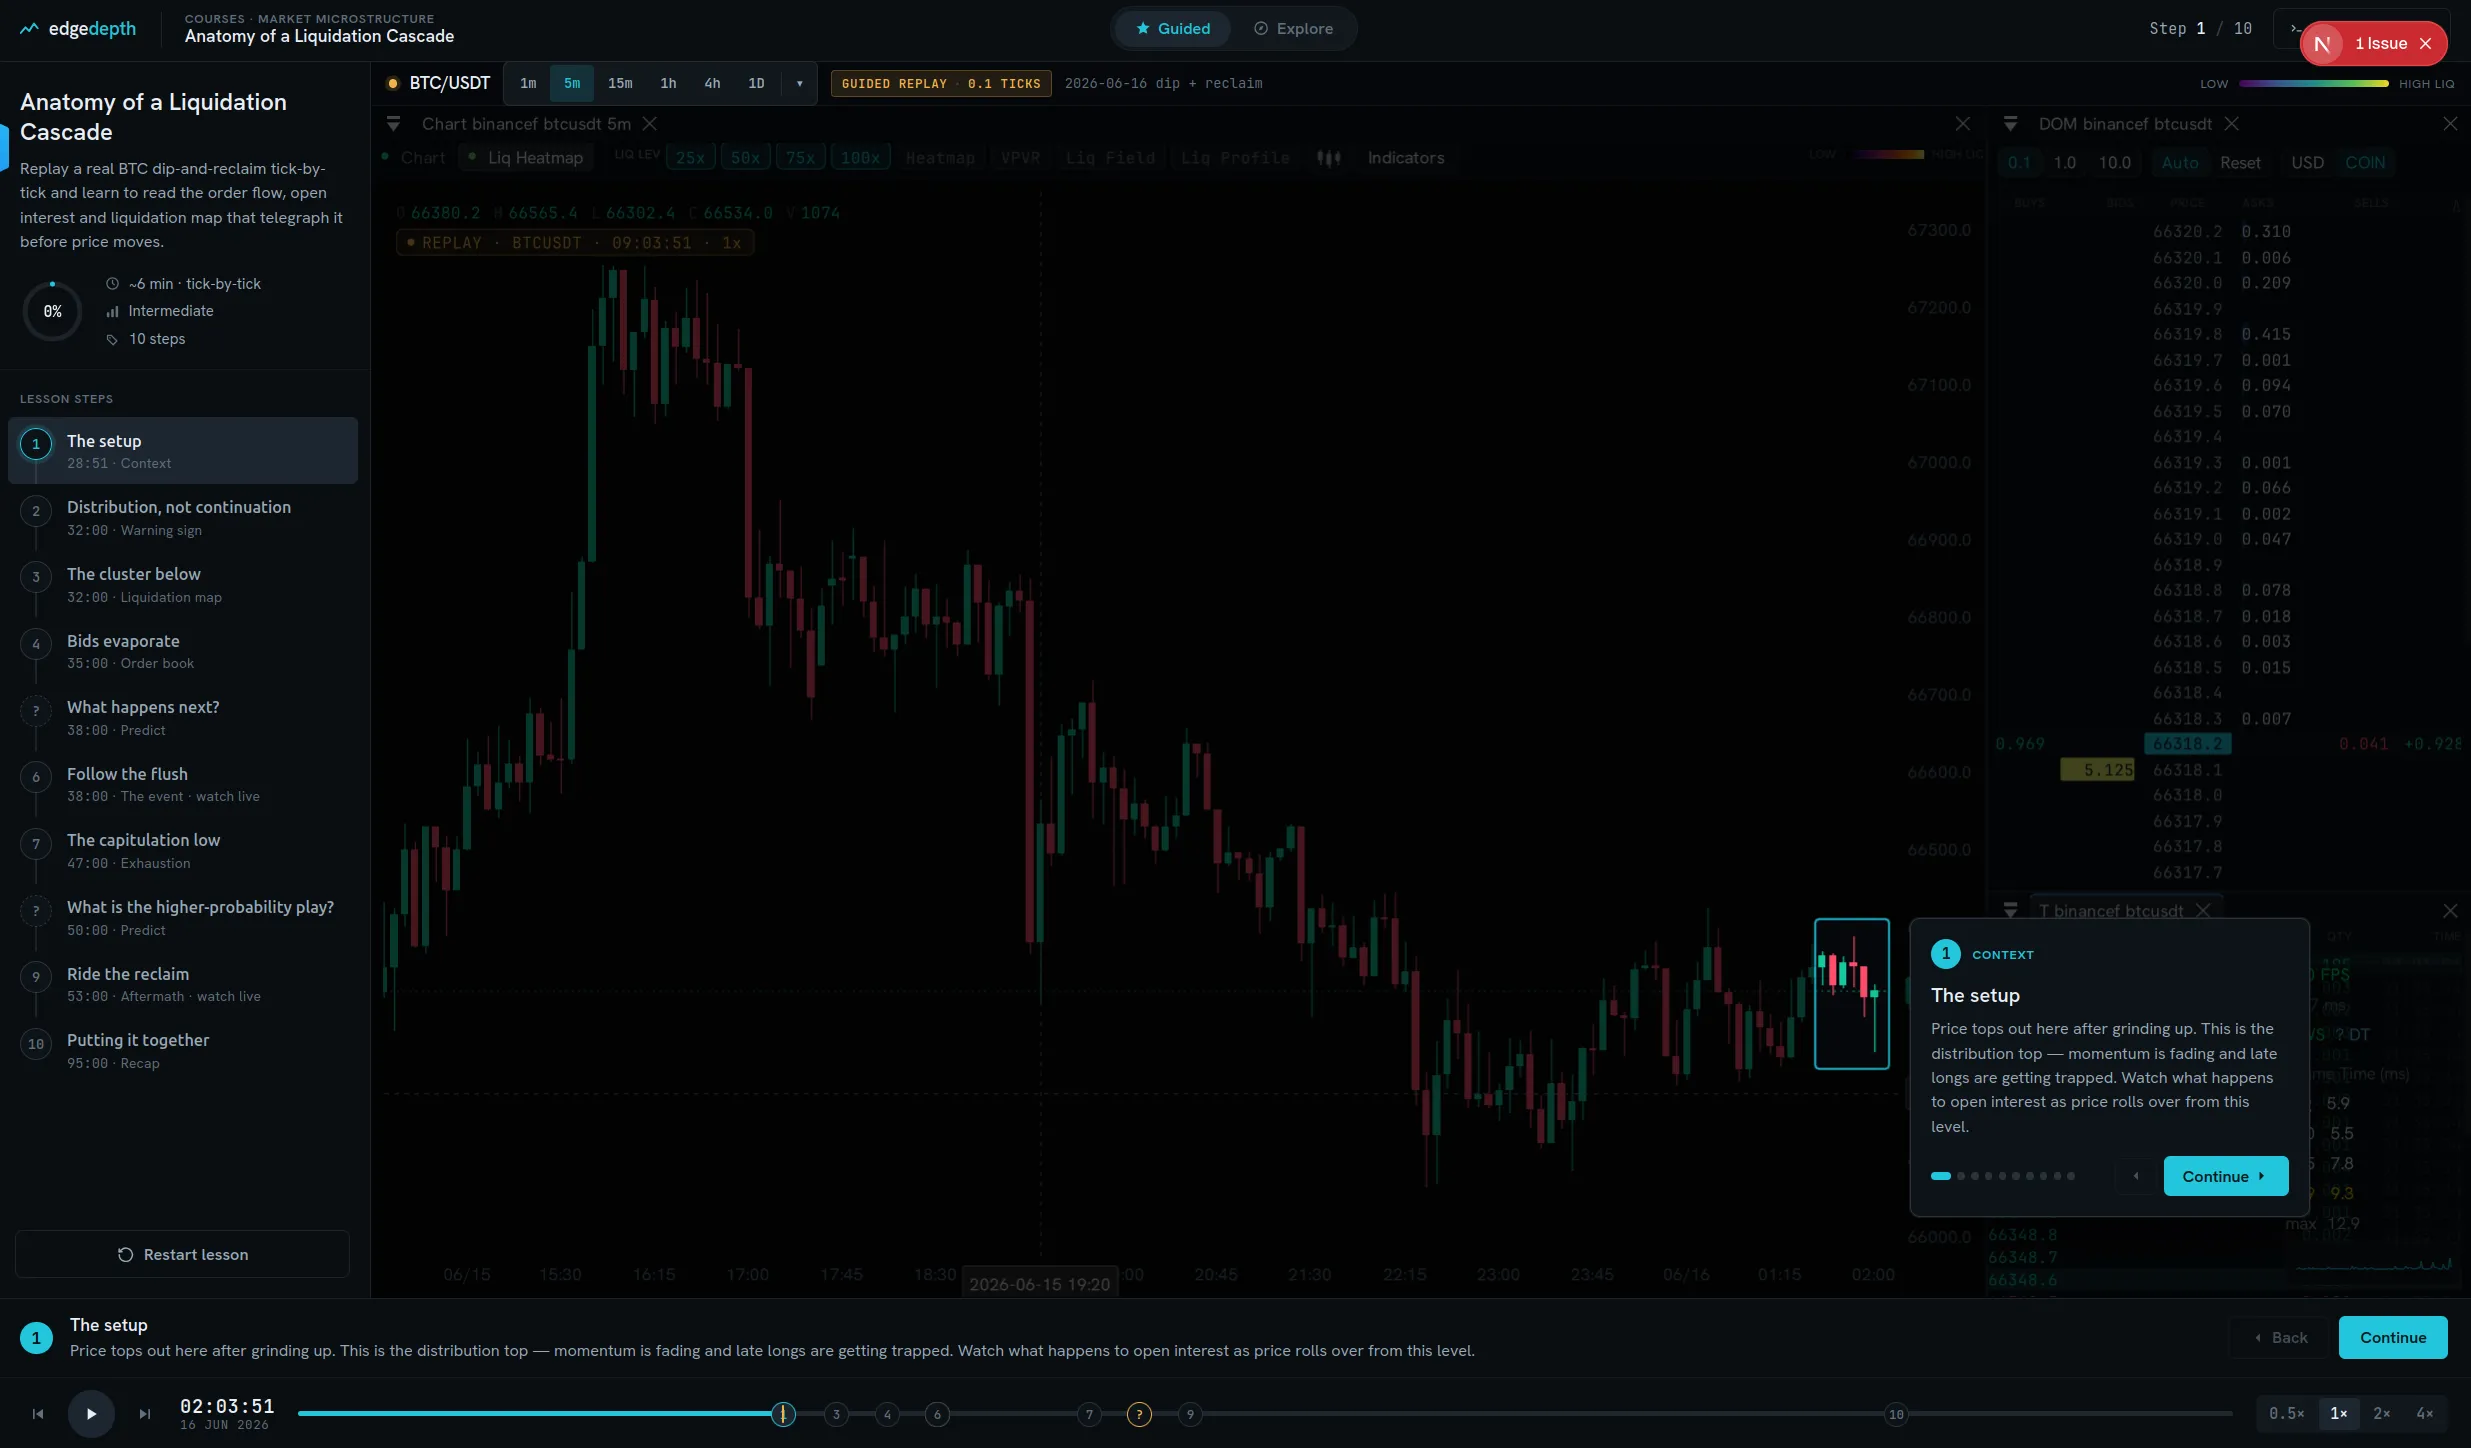
The guided replay drops you into a real occurrence of this setup and plays it tick by tick: the order book, the tape, the liquidations. You watch the setup form, then you call the next move before the market answers.
Then the lesson does the thing a single chart never can: it shows you the base rate across every occurrence, with its denominator, so the one persuasive example is put back in its distribution. That gap, between the chart and the count, is the whole point.
Does your setup actually work?
Find out before you fund it.
Describe it in plain English, get every time it happened with the denominator, and replay any of them.