At a glance
After 7,975 forced-selling cascades, price got halfway back before falling as far again 48.1% of the time, slightly less often than after an equally fast drop without forced selling (51.0%). Buying the end of a cascade lost money after costs.
Scope Binance USD-M crypto perpetuals, 650 markets (TradFi-referencing contracts excluded) · 5-minute bars and open-interest snapshots from Binance's public archive · entries from 1 September 2024 to 12 September 2026 · 7,975 cascades.
In this article
The belief is everywhere: after a liquidation cascade, price snaps back. Forced sellers sell at any price, the move overshoots, and patient buyers are rewarded. Look at a chart of a flush and the long lower wick seems to prove it.
We tested it. The short answer is no, not in the way that would help you trade. The longer answer is more useful: two results along the way looked like a real edge, and our process caught both.
The question, written down first
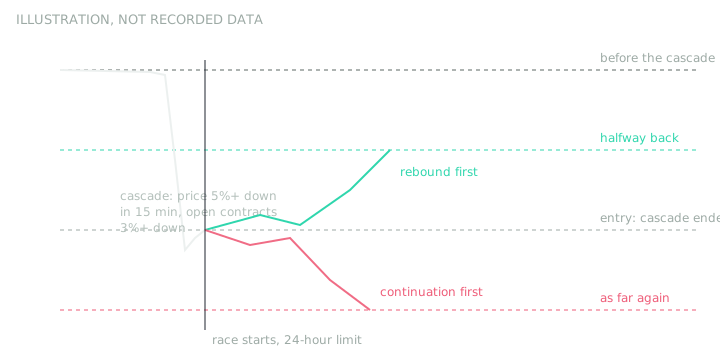
A “cascade” here is a Binance perpetual falling 5% or more within 15 minutes while its open contracts fall 3% or more. Holders are being closed out into the fall: liquidated, stopped or panicking. The cascade ends at the first 5-minute close where that is no longer true. That end is where a buyer would step in.
From there we ran a race. Does price climb halfway back to where it was before the cascade before it falls the same distance again, within 24 hours? With no drift, each side would win about half the time, so 50% is the line to beat. The race is sized to each cascade, so a 6% flush and a 40% flush are judged alike.
A rebound can’t only be measured against 50%. So we also compared cascades with equally fast drops in which open contracts did not fall: drops that forced nobody out. If forced selling causes an overshoot, cascades should rebound more often than those.
All of this was written down before a single cascade was counted, along with the pass rule and our own guesses. We put the chance of finding a rebound at 35% and 40%. Writing guesses down lets us keep score of our own judgment over time.
Trap one: “eventually”
Within 24 hours, price touched the halfway-back level after 70% of cascades. On a chart that reads as “cascades rebound”.
It touched the further-down level after 75% of them.
Both happen, and a trade cares about the order. A buyer with a stop can’t collect the rebound if the stop is hit first. Counted as a race (shares of the races decided within 24 hours), the answer changes:
| Group | Events | Halfway back first | As far again first |
|---|---|---|---|
| Cascades (forced selling) | 7,975 | 48.1% | 51.9% |
| Equally fast drops, nobody forced out | 6,991 | 51.0% | 49.0% |
Cascades rebounded slightly less often than ordinary drops, in both years we checked. A long bought at the end of the cascade, with its stop and target at the race levels, averaged +0.18% after costs, driven by a handful of huge winners. The typical trade lost 1.65%, and the earlier year lost money on average.
Trap two: one day
Deep cascades, where the low sat 30% or more below the pre-cascade price, looked spectacular. They got halfway back first 67% of the time, and the long averaged +12%.
We had required that any result hold in both halves of the year. It didn’t: 78% in one half and 34% in the other. So we looked at where the events came from.
| Deep cascades | Events | Halfway back first | Average long after costs |
|---|---|---|---|
| 10 to 11 October 2025, a market-wide crash | 245 | 86% | +22.9% |
| Every other day | 201 | 39% | -1.5% |
More than half the “edge” was one day. On every other day, deep cascades tended to keep falling. Without the both-halves rule, one historic flush would have become a strategy. We now require every result to survive with its busiest day removed.
Trap three: time itself
A later check found that Binance’s public open-interest snapshots are stamped about five minutes before the moment they measure. Every open-interest reading in the study had therefore seen five minutes of the future. We fixed the timing and reran everything. No conclusion changed, but it could have, and a live signal can’t see the future.
What did hold
Forecasting direction after a cascade failed. Forecasting risk did not. In a separate pre-registered question, we asked whether a cascade is likely within the next hour.
- Public data already ranks the risk well. Recent volatility, volume and the recent move put two-thirds of next-hour cascades in the riskiest 5% of market-hours.
- Our own recorded order book improved the forecast further. How much it costs to sell $100,000 into the bids, and bids being pulled, both added to it. The gain is modest.
- It is being checked on new data through January 2027 before we claim it anywhere.
This is the pattern across everything we have tested so far. Forced flows help you estimate how big the next move could be. They rarely tell you which way.
Why this matters for your research
None of this needed exotic mathematics. It needed habits that are easy to skip when a chart looks convincing:
- Write the question down before looking, in terms precise enough to count.
- Compare with something. A rate means little until you set it beside a reference.
- Count the whole population, not the memorable examples.
- Check a second period, and make sure no single day carries the result.
- Check what was knowable at the time.
- Watch it forward before trusting it.
EdgeDepth’s research tools are built around several of these. The Workbench shows the exact question before anything runs, counts every match with a reference beside it, and lets you re-run the same question on other dates. Saved watches a definition going forward. The discipline of deciding the rules in advance is still yours: we show you the evidence, not a verdict.
Most of what we test turns out to be noise. A tool that helps you find that out quickly, before you trade on it, is worth more than one that finds you a pattern.