Compare · Kingfisher
EdgeDepth vs Kingfisher
Kingfisher keeps its model private. EdgeDepth scores its levels in public.
Kingfisher sells liquidation maps from a proprietary model, with options flows and trade signals. EdgeDepth draws its levels in dollars, checks them every day in public, and replays the recorded book and trades behind any move.
What EdgeDepth adds
-
A score, not a claim
Kingfisher's API page claims "40% more accurate liquidation detection than competitors"; we found no dataset or method behind it. EdgeDepth publishes how often price sat at its levels and how much of the reported liquidations came then, misses included.
-
Dollars, not a Z-score
Kingfisher's heatmap docs describe its colour as a Z-score of normalised data. EdgeDepth gives each level its estimated dollars and shows the liquidations the exchange reported beside it.
-
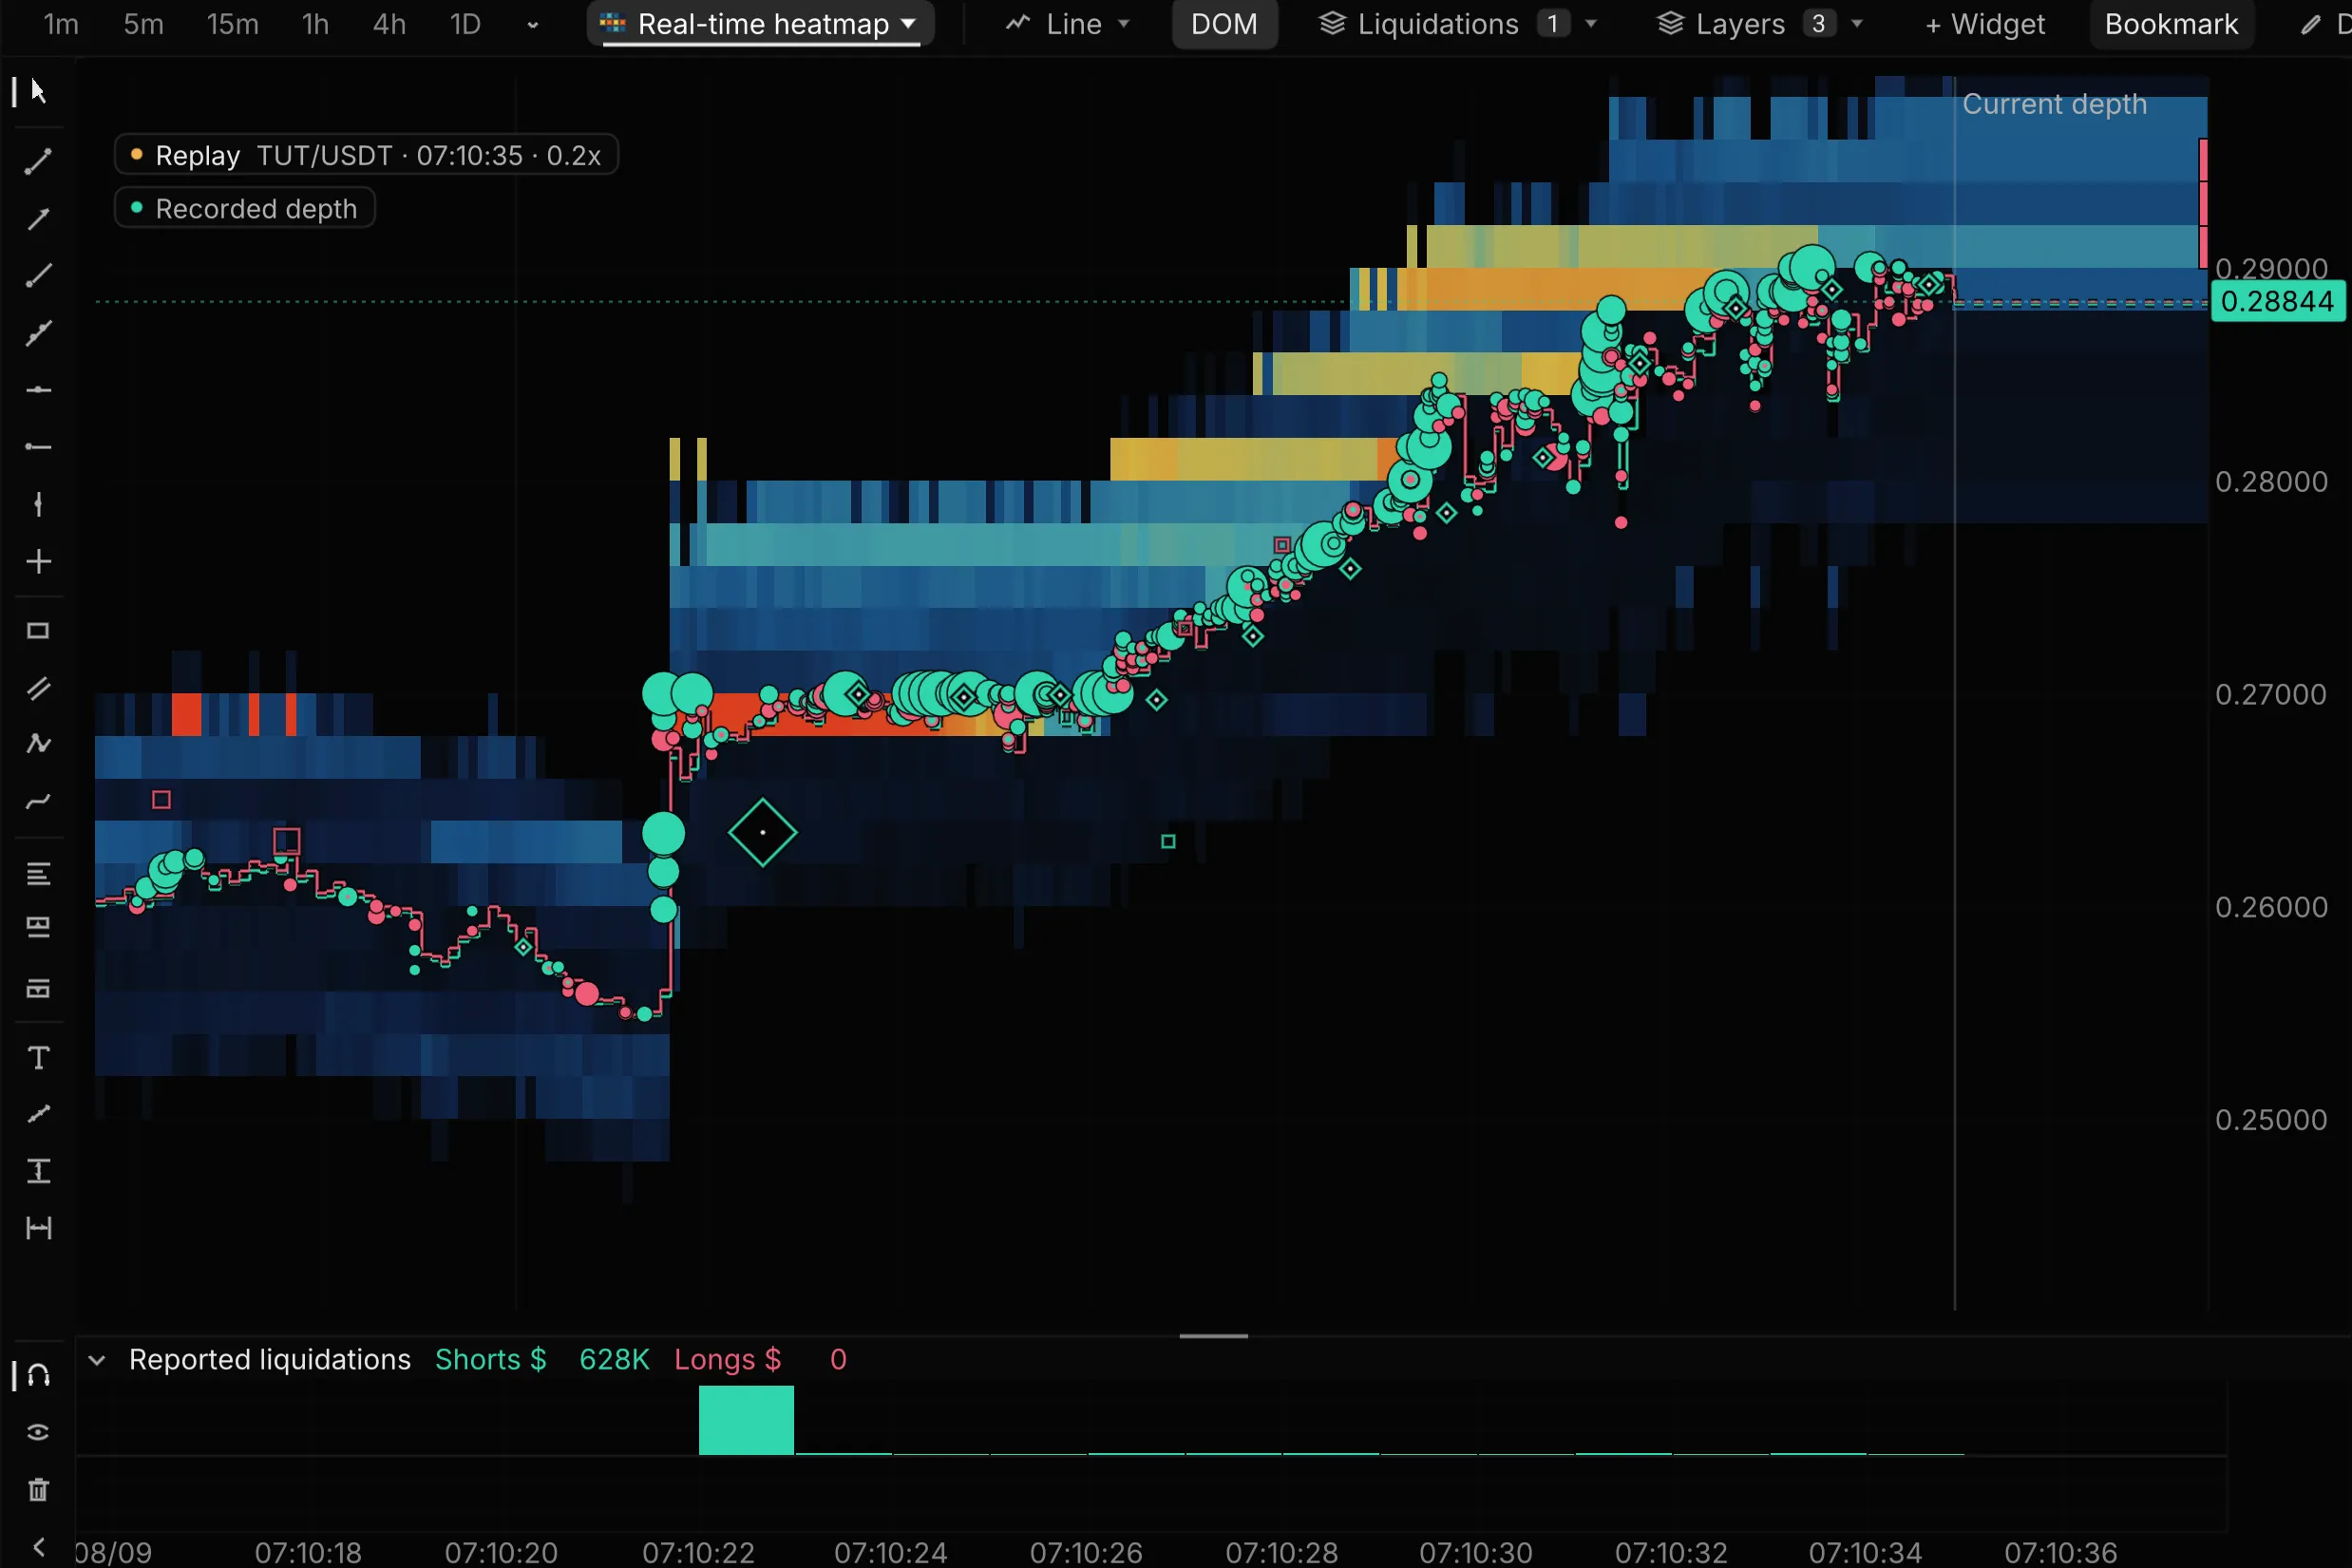
Replay the move
Kingfisher loads past map snapshots by date and time; no market replay was found on its pages. EdgeDepth replays the recorded book, every trade and the reported liquidations, from a candle or from a level price reached.
Side by side
| Question | Kingfisher | EdgeDepth |
|---|---|---|
| Liquidation map | A proprietary model whose "private inputs, weightings and transformations are not published". Six leverage presets; single-venue maps on 7 venues including Hyperliquid; the heatmap covers Binance. | Liquidation rails on Binance and Bybit: modelled levels in dollars, each ended by the candle that reaches it. BTC's map is free to everyone; every other market is part of Pro. |
| Accuracy | Claims "40% more accurate liquidation detection than competitors"; no dataset or method found. | Checked every day against the liquidations the exchange reported, misses included, on each coin's map page. A registered forward test of the rails publishes its result on or after 16 November, pass or fail. |
| Replay | None found. Past map snapshots load by date and time. | Click a level price reached to replay that minute, or right-click any candle: the recorded book, every trade and the reported liquidations. Up to 30 days of Binance on Pro. |
| Hyperliquid | A Hyperliquid map view; its pages do not say it is built from real positions. | Levels from the exchange-reported liquidation prices of observed positions, with the share of open interest they cover in the chart's key. Free on BTC, Pro on every other coin. |
| Reported liquidations | No feed of reported liquidations found. | Binance and Bybit reports on every market with Pro, live and in replay. Binance does not publish every liquidation, so its figures are a floor. |
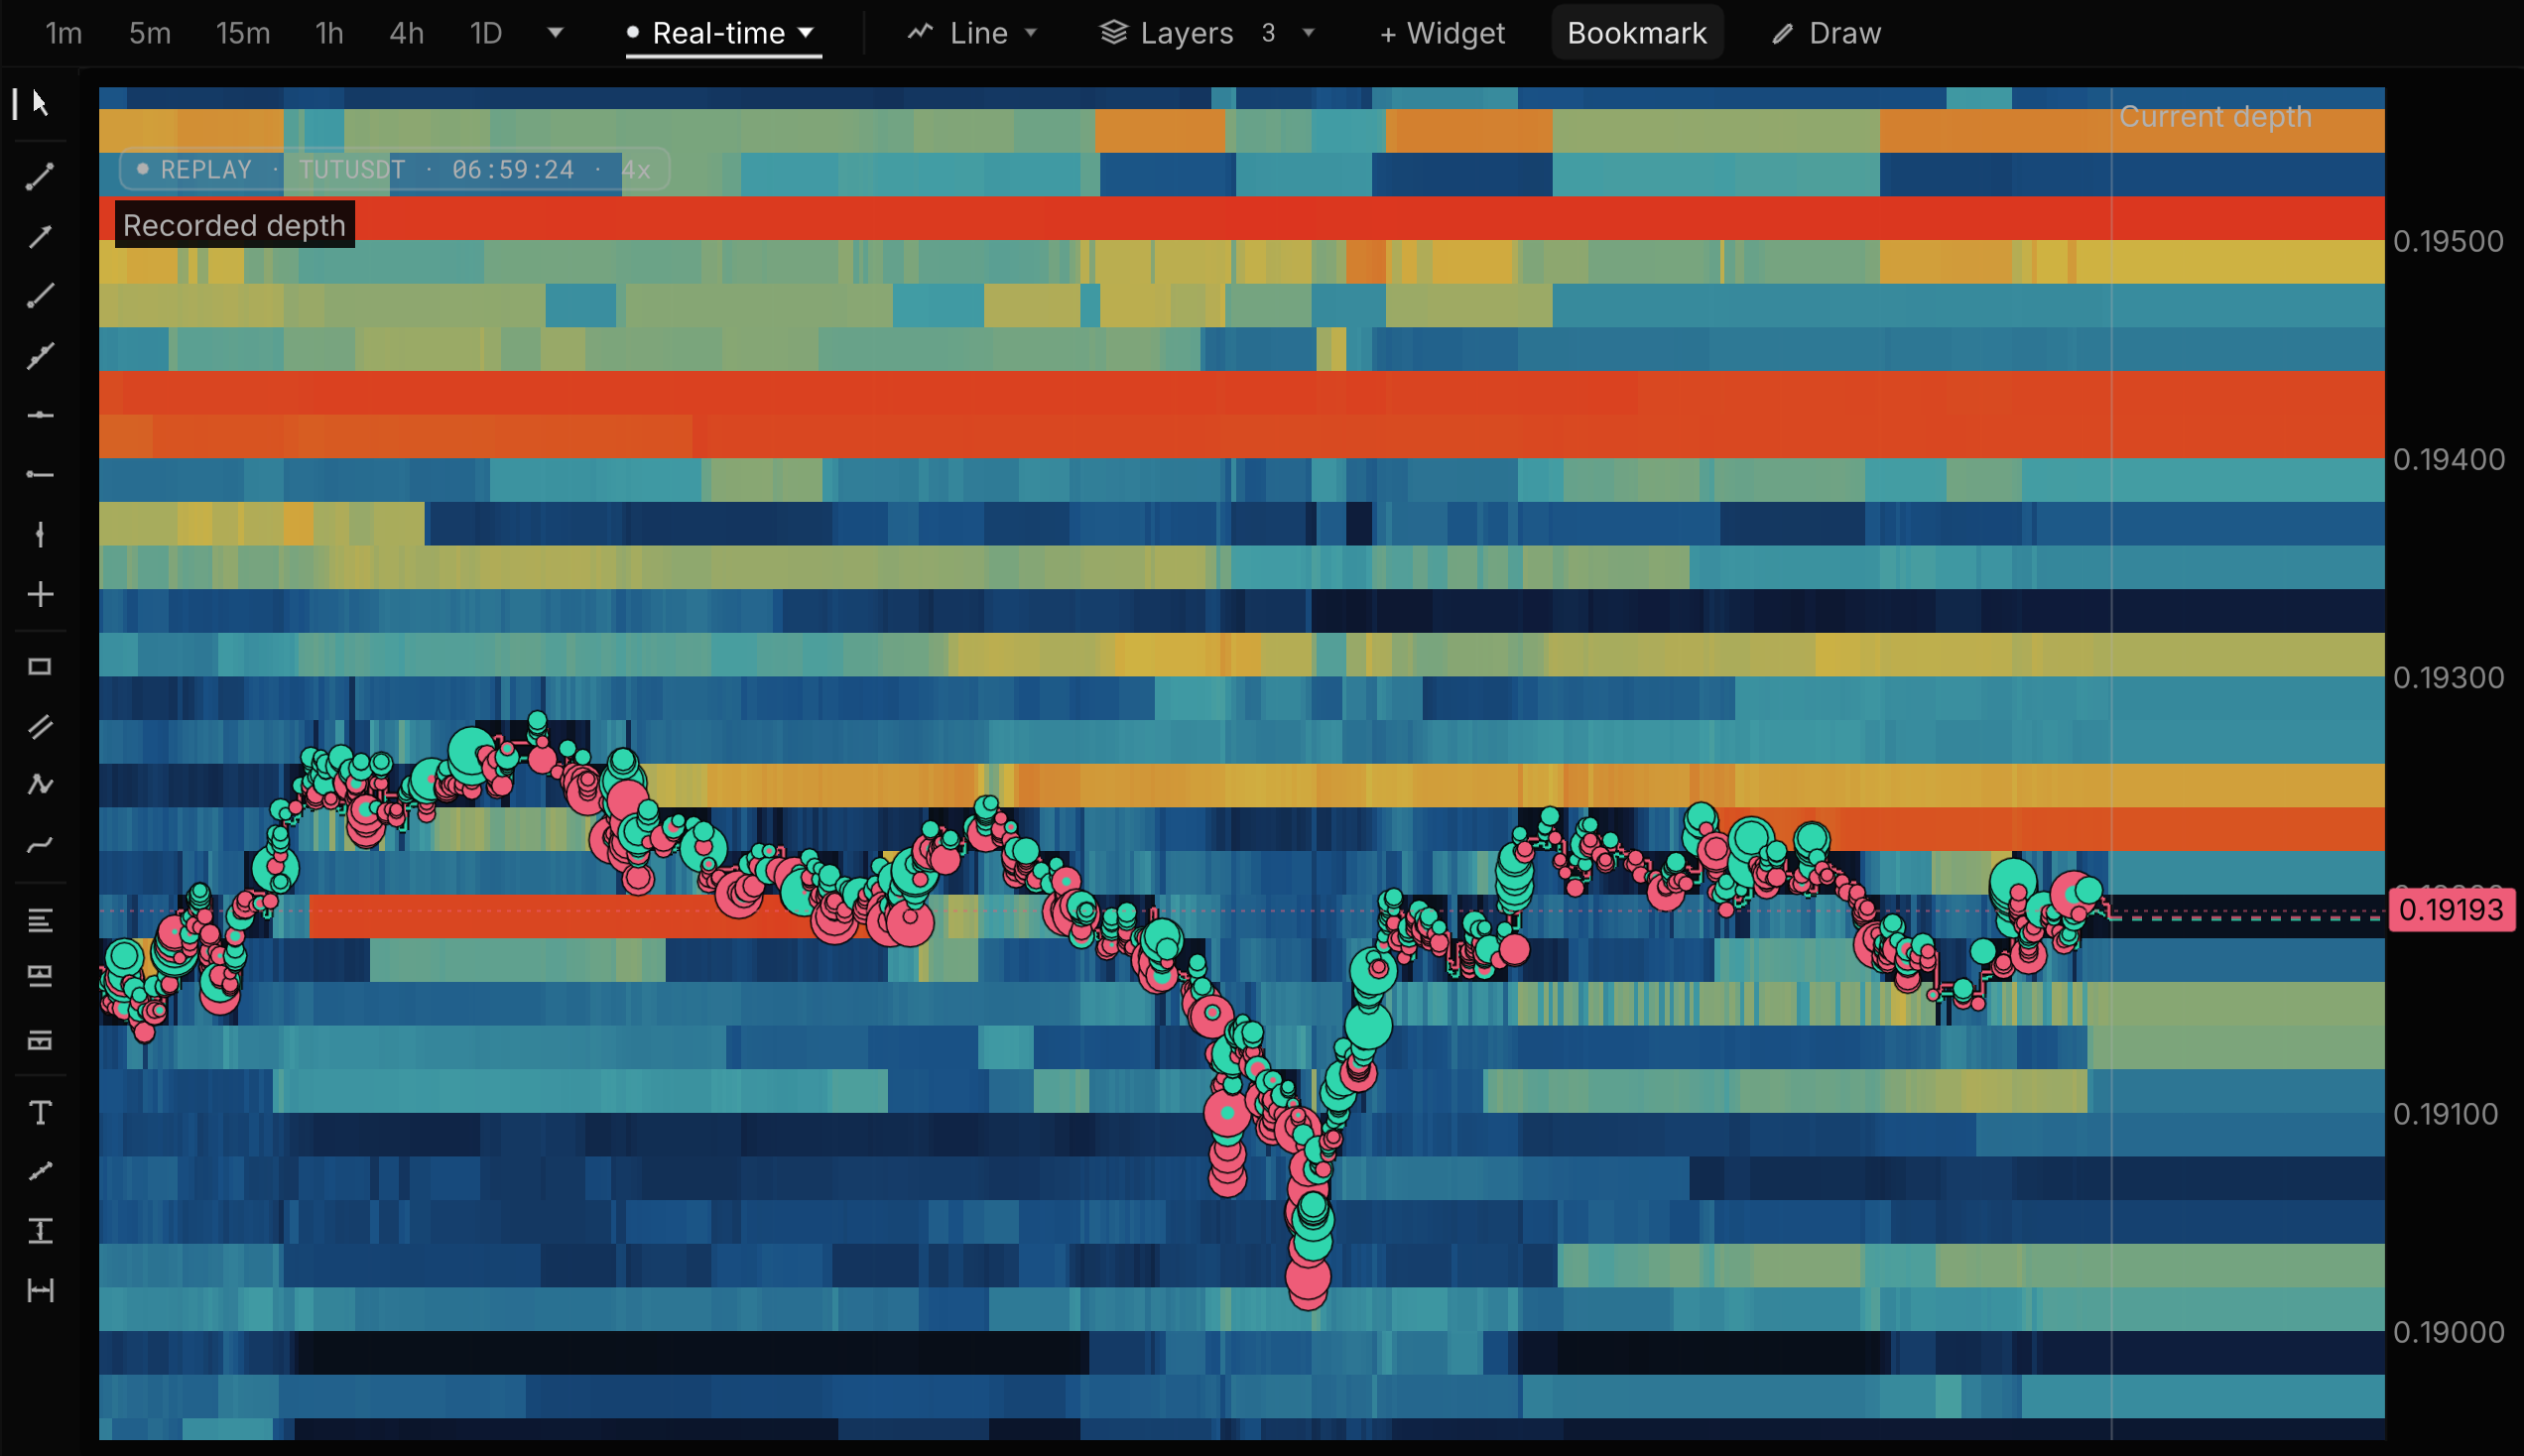
| Order flow | Trades, counters, an aggregated order book and toxic order flow widgets; no order book heatmap or DOM found. | Real-time order book heatmap with trade bubbles, live and in recorded replay. Footprint and TPO are free on every supported market. Read traded volume at each price and footprint imbalances. |
| Price | Premium $79 a month or $780 a year; Pro (aggregated and multi-coin maps) $109 a month or $1,080 a year; API from $499 a month. | Free: Bitcoin live depth all day. Pro $29/mo, or $20/mo billed yearly. |
Scored in public
Every level we draw is checked against what happened.Misses included.
Any tool can draw bright lines. Without a score, you cannot tell a level that matters from one that just looks good. A map that shows its misses is one you can believe when it hits.
 BTC/USDT
 Binance Futures
5 to 12 Oct 2026 · 8 scored days
9%of the time, price sat at our BTC levelsabout 15 of 172 hours scored
64%of the liquidated dollars came in those minutes$197.76M of $308.58M reported
Price at our levelsEverywhere else
7.2×the average rate of liquidated dollars, while price sat at our levels
How it is scored
- We checked 11 liquidation map and heatmap tools on 4 October 2026. None published how often its levels met real liquidations.
- The harder test is still running: we wrote down the pass and fail rules for our liquidation rails before 13 October, and publish the result on or after 16 November, pass or fail. Read the registered test →
- Liquidations bunch up in big moves, which also reach more levels, so the time bar flatters the map. Binance’s reported feed is a lower bound, so dollar figures are a floor.
When Kingfisher is the better choice
- You want many map variants: leverage presets, single venues, an aggregated view and several coins at once.
- You trade BTC or ETH options and want gamma exposure and other options flows.
- You want model trade signals with a direction and a target.
- You follow its maps on Telegram, or want automated execution.
Use both
Read Kingfisher's map for where pressure might build. When price gets there, replay the book, the trades and the liquidations in EdgeDepth to see what actually happened.
Questions
Is the Kingfisher liquidation map accurate? #
Kingfisher publishes no accuracy study on the pages we checked and calls its maps "probabilistic". Its API page claims 40% more accurate detection than competitors without a dataset or method. EdgeDepth publishes its own score every day: how often price sat at its levels and how much of the reported liquidations came then.
Does Kingfisher have replay? #
Not on the pages we checked. It loads past map snapshots by date and time. EdgeDepth replays the recorded order book, trades and reported liquidations in the browser.
Can I try EdgeDepth before paying? #
Yes. Watch Bitcoin live, free, all day, and replay a recorded move with no sign-up. A free account also replays the past 3 days of BTCUSDT and any archived move from the past 7 days. Footprint and TPO are free on every market.
EdgeDepth is in early access. Is it ready to use? #
Yes. Live order flow, tick replay, the event archive and the liquidation maps are live today. Early access means the workflows around them are still improving, and Research is still in development. Paid plans carry a 14-day money-back guarantee. Founder rate: your price never rises while you stay subscribed.
Sources, checked 20 Oct 2026
Watch Bitcoin live.
Free, all day.
Then replay a recorded move with no sign-up, tick by tick, with the liquidations behind it.
No card · Not a trial · 14-day money-back on paid plans